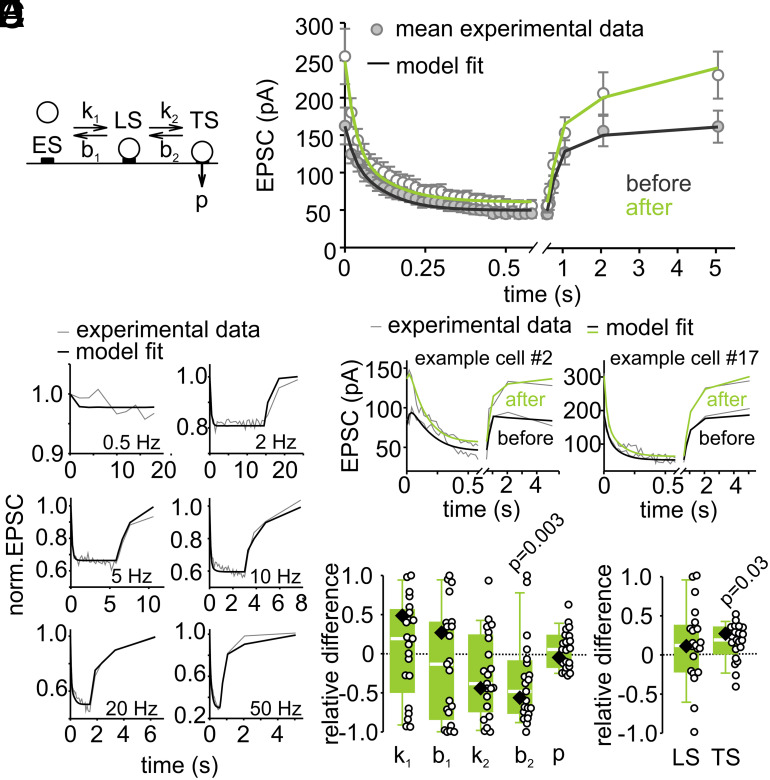
Fig. 3.
A sequential two-step priming model indicates an increased number of tightly docked vesicles following LTP induction. (A) Sequential model containing empty sites (ES), loosely docked vesicles (LS), and fusion-competent tightly docked vesicles (TS). (B) Model fit to average EPSC trains recorded in response to various stimulation frequencies. (C) Model fit to the mean 50-Hz EPSC train and the recovery EPSCs recorded in inducible connections before and after LTP induction. (D) Model fits to individual 50-Hz EPSC trains and recovery EPSCs before and after LTP induction in two example cells. (E) LTP-induced individual (circles) and median relative differences (eq. 7 in SI Appendix, Methods) of the predicted model parameters (diamond = parameter obtained from model fit to the average of all inducible connections). P values were calculated by comparison of respective parameters before and after LTP induction by Wilcoxon-signed rank tests.

