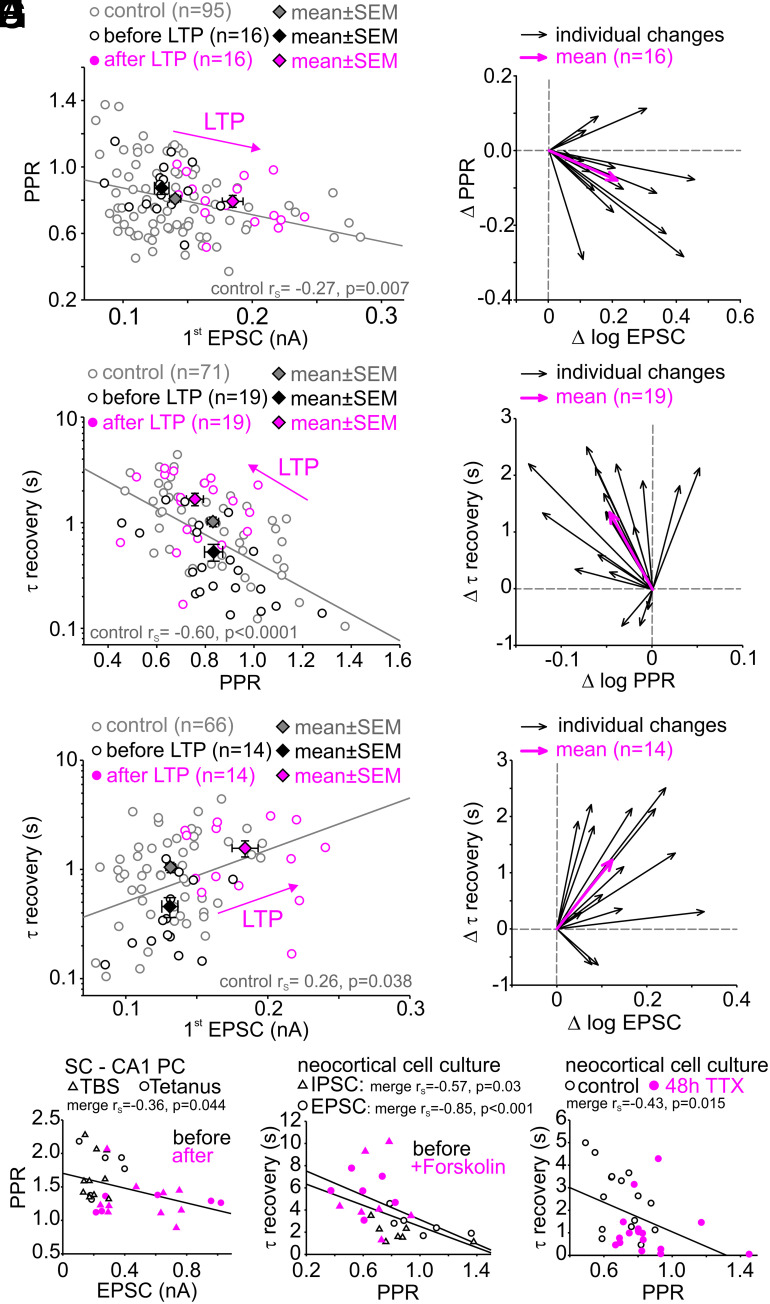
Fig. 4.
Stronger synapses recover more slowly from short-term depression. (A) Scatter plot of PPR vs. first EPSC amplitude in layer 5 pyramidal cells before and after LTP induction. (B) Vector plot showing individual (black arrows) and average (magenta arrows) changes in EPSC size and PPR for inducible connections (n = 16). (C) Scatter plot of the time constant of recovery from synaptic short-term vs. PPR before and after LTP induction. (D) Vector plot showing individual (black arrows) and average (magenta arrows) changes of recovery from short-term depression and PPR of inducible connections (n = 19). (E) Scatter plot of time constant of recovery from synaptic short-term depression vs. EPSC amplitude before and after LTP induction. (F) Vector plot showing individual (black arrows) and average (magenta arrows) changes of first EPSC amplitude and recovery from synaptic short-term depression of inducible connections (n = 14). (G) Scatter plot of PPR vs. EPSC size (cf. Fig. 4A) before and after plasticity induction by theta burst (TBS)- or tetanic stimulation of Schaffer collateral to CA1 pyramidal cell synapses in acute brain slices. (H) Scatter plot of time constant of recovery vs. PPR (cf. Fig. 4B) for high-frequency (20 pulses at 20 Hz) IPSC (triangles) and EPSC (circles) trains before and during forskolin application in synapses of cultured neocortical neurons. (I) Scatter plot of time constant of recovery vs. PPR (cf. Fig. 4B) for control high-frequency IPSC trains (20 pulses at 50 Hz) and after induction of homeostatic plasticity by inactivity (48 h TTX) in synapses of cultured neocortical neurons. Note, the homeostatic plasticity-induced shift of IPSCs toward larger PPR and faster recovery from short-term depression.

