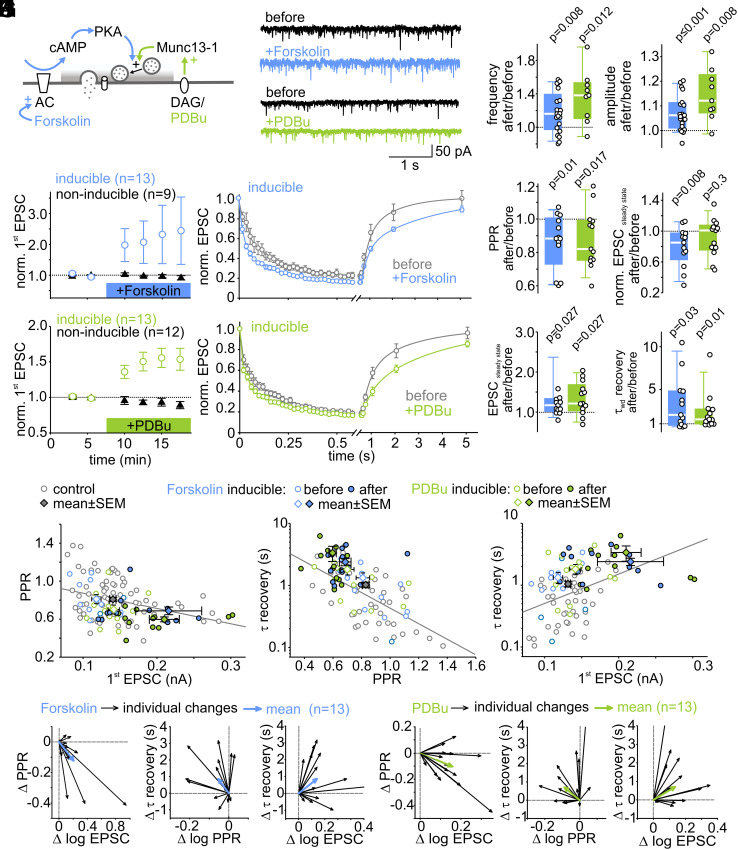
Fig. 5.
Forskolin- and PDBu-induced potentiation slows recovery from short-term depression. (A) Schematic of forskolin- and PDBu-activated signaling pathways. (B) Example traces of spontaneous EPSCs (sEPSCs) before (black) and after (colored) forskolin or PDBu application. (C) Individual and median relative changes in sEPSC frequency (Left) and amplitude (Right) before and after forskolin or PDBu application. For sEPSC analysis, data from inducible and non-inducible connections were pooled. (D and E) Mean normalized initial EPSC amplitudes of inducible and non-inducible connections (Left) and mean normalized 50-Hz EPSC trains and recovery EPSCs of inducible connections (Right) before and during forskolin (D) or PDBu (E) application. (F) Individual and mean relative changes in PPR, absolute and normalized steady-state EPSC amplitudes, and recovery time constant in inducible connections after forskolin or PDBu application. (G–I) Scatter plot of PPR vs. initial EPSC (G, two data points out of range), recovery from short-term depression vs. PPR (H, one data point out of range), and recovery from short-term depression vs. EPSC size (I, three data points out of range) before and after potentiation by forskolin (n = 13) and PDBu (n = 13) (control data same as in Fig. 4 A, C, and E, respectively). (J and K) Vector plots showing individual (black arrows) and average (blue arrows) changes in PPR and EPSC size (Left), PPR and recovery from short-term depression (Middle), and recovery from short-term depression and EPSC size (Right) for forskolin (J) and PDBu (K) inducible connections.

