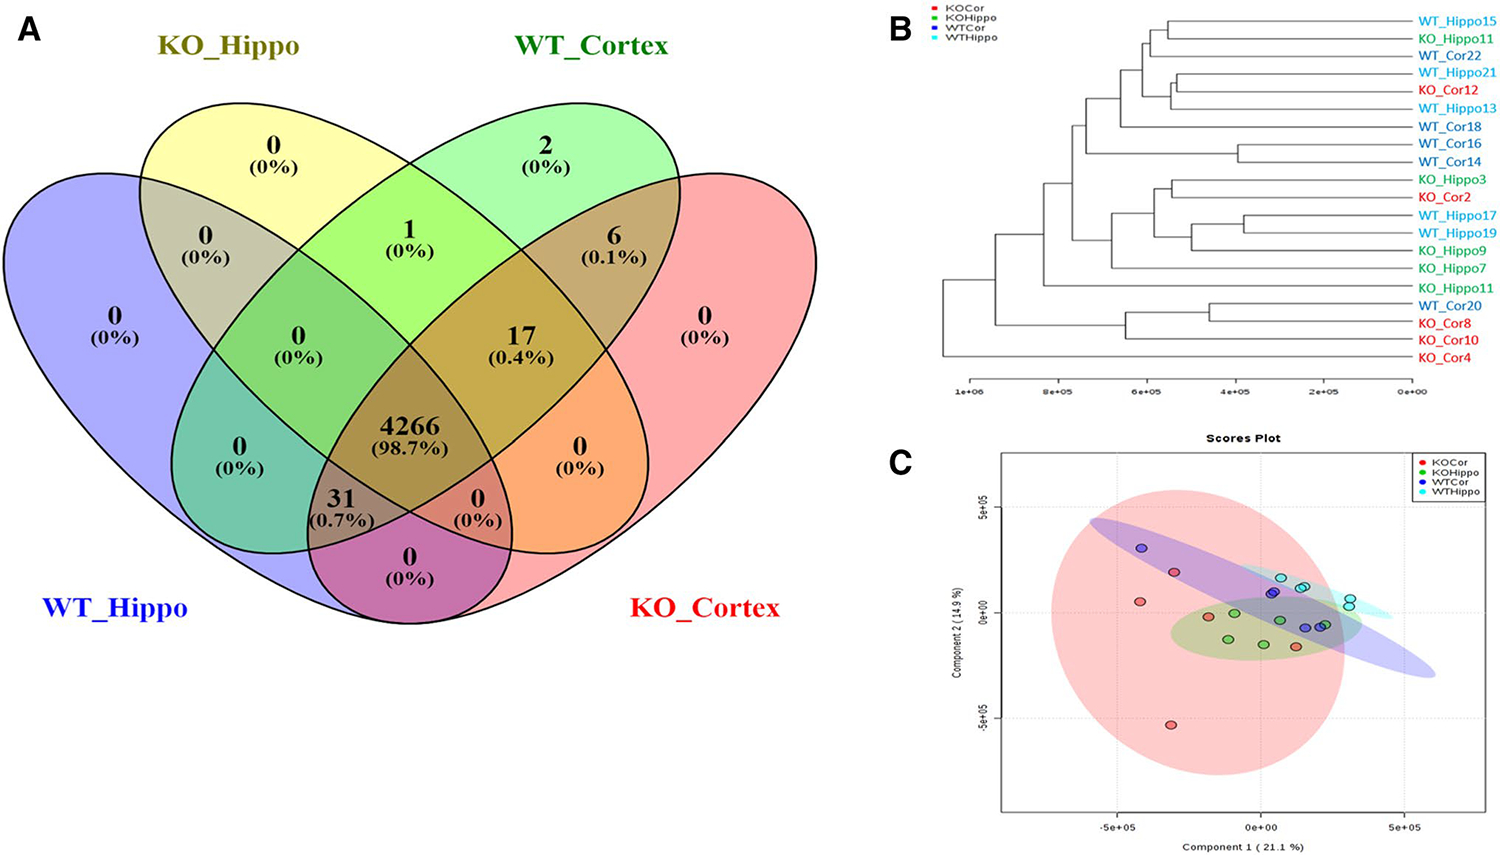
Fig. 1.

a Venn Diagram showing the uniqueness and overlap of all features. b Hierarchical clustering based on all features from each tissue. c PLS-DA score plots comparing the lipidomic profiles between hippocampal and cortical tissue in addition to wild-type vs. KV1.1−/−
