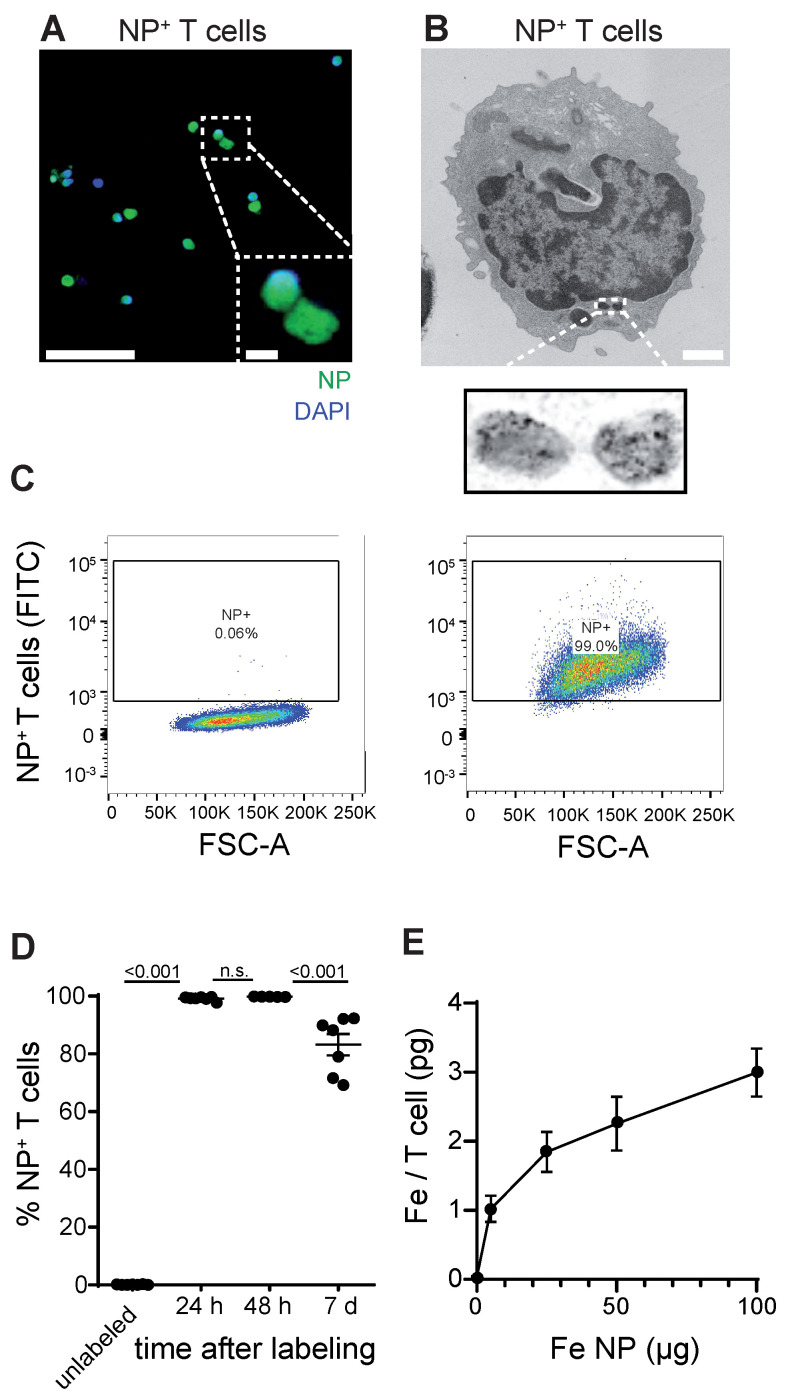
Figure 1.
A: Confocal image of iron oxide NP labeled T cells B: Transmission electron microscopy (TEM) of NP labeled primary murine T cells. C: Flow cytometry plots of unlabeled and iron oxide NP labeled primary murine T cells after 24 h incubation with NP in vitro D: Quantification of iron oxide NP labeling efficacy after 24 h, 48 h and 7 days, assessed by flow cytometry E: Quantification of iron uptake per T cell after 24 h incubation with iron oxide NP in vitro, assessed by ICP-OES. Scale bars are 20 µm in confocal microscopy image, 2 µm in inset and 500 nm in EM.

