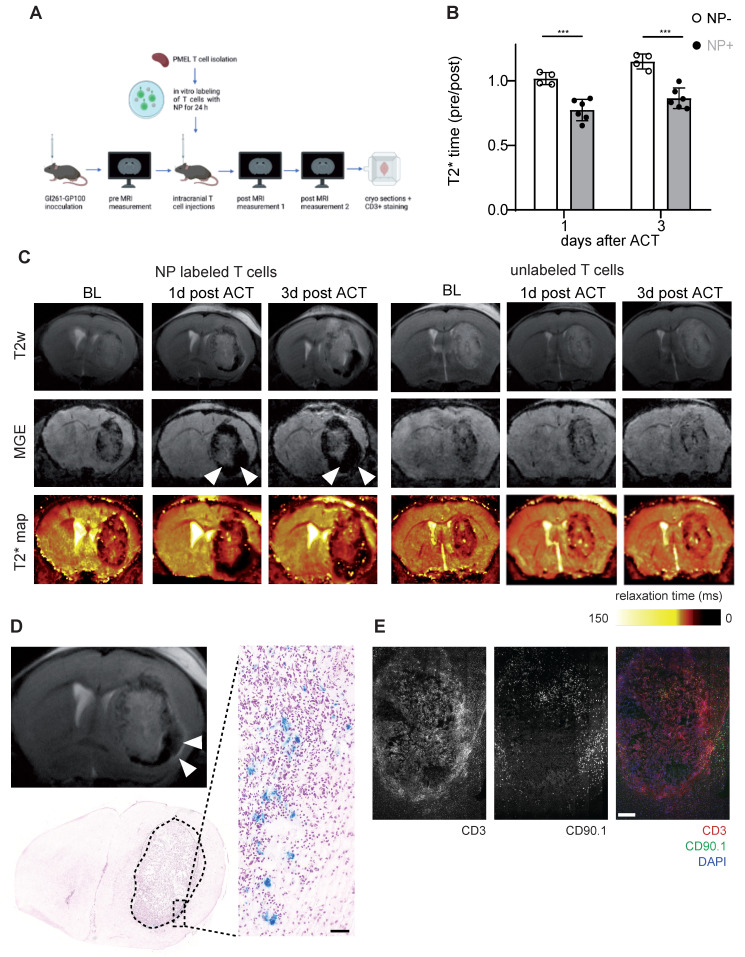
Figure 4.
A: Schematic experimental outline of intratumoral T cell injections and subsequent MRI measurements B: Quantification of tumor relaxation time 1 and 3 days after intratumoral ACT with iron oxide NP labeled T cells or unlabeled T cells from T2* maps. Relaxation time was normalized to the baseline (pre) measurement before ACT C: T2w, MGE and T2* map of mouse brain with intratumoral ACT (iron oxide NP labeled vs unlabeled T cells) D: Prussian blue staining after intratumoral ACT with iron oxide NP labeled T cells in comparison to MR image E: Immunohistochemistry of CD3+ / CD90.1+ / DAPI co-staining, imaged by confocal microscopy.

