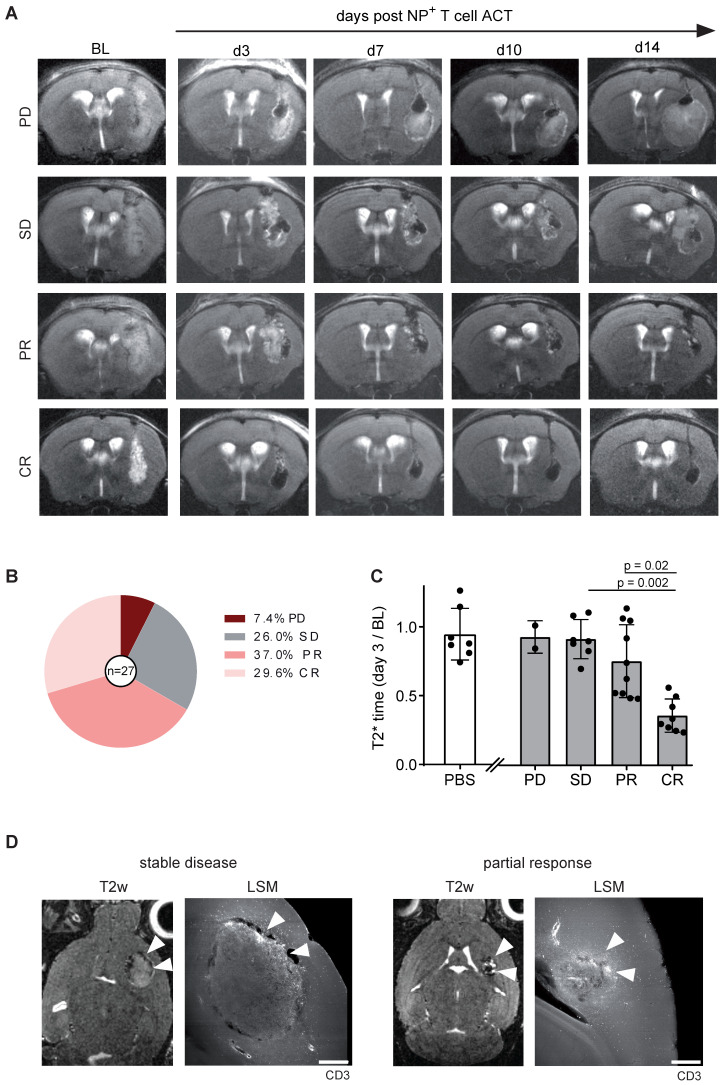
Figure 5.
A: T2w MR images OVA-Gl261 bearing mice following intratumoral iron oxide NP labeled OT-1 ACT. Representative examples of progressive disease (PD), stable disease (SD), partial response (PR) and complete response (CR) are shown. B: Response towards ACT with OT-1 T cells. n = 27 mice. Pooled data from two independent biological experiments C: T2* relaxation times of the tumor within the response groups. PBS was injected in a negative control group. D: T2w MRI of intratumorally injected, NP labeled OT-1 T cells in Gl261-Ova model on day 14 after ACT in correlation to iDISCO cleared LSM images of CD3+ T cells. Arrowheads indicate sites of T cells accumulations. Scale bar is 500 µm.

