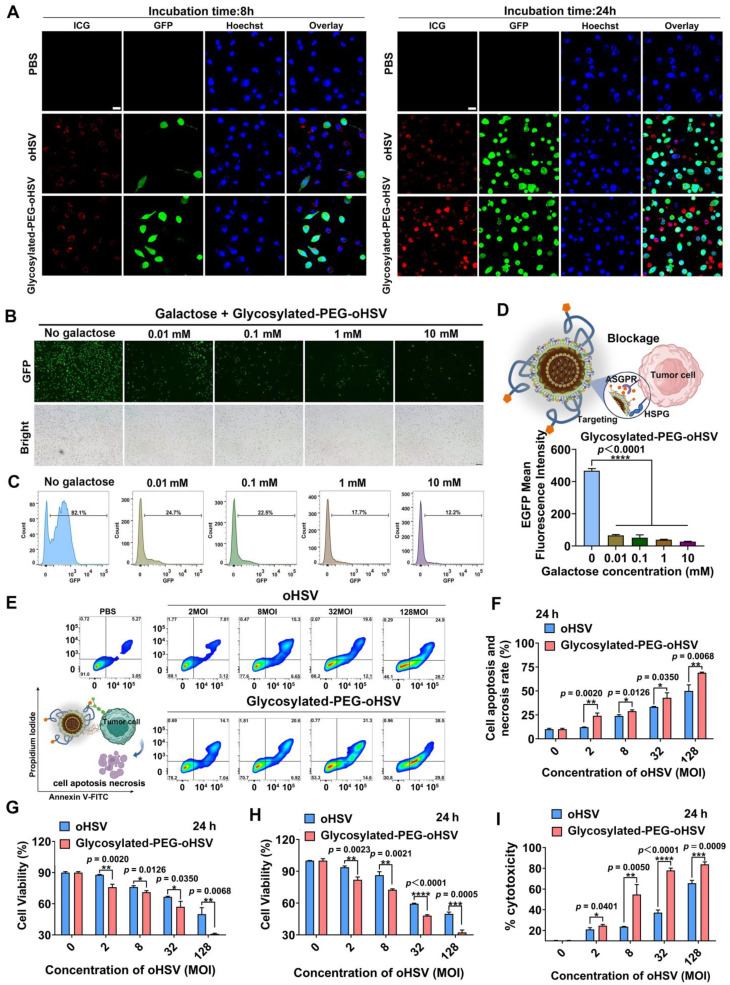
Figure 2.
(A) CLSM images of Hepa1-6 cells treated with ICGglycosylated-PEG-oHSV or ICG oHSV after 8 h and 24 h, respectively. The red color represents ICG, the green color represents EGFP expression, and the blue color represents Hoechst (nuclear). Scale bar, 20 μm. (B) Cell infection efficiency of glycosylated-PEG-oHSV or oHSV in Hepa1-6 cells after blocking ASGPR with different galactose concentrations for 1 h through fluorescence imaging and (C) flow cytometry analysis. (D) Quantification of the EGFP expression by flow cytometry in Hepa1-6 cells after blocking ASGPR with different concentrations of galactose and then treated with glycosylated-PEG-oHSV. (E) and (F) Cytolytic activity was determined by co-incubating glycosylated-PEG-oHSV or oHSV with Hepa1-6 cells for 24 h, followed by analysis using FACS with Annexin V-FITC and PI staining. (G) The percentage of apoptosis and necrosis in Hepa1-6 cells after indicated treatments (n = 3). Cell viability of Hepa1-6 cells was analyzed by CCK8 assay (H) and LDH assay (I) after treatment with different titers (0-128 MOI) of oHSV or glycosylated-PEG-oHSV (n = 3). Statistical analysis was performed using ANOVA analysis, **p<0.01, ***p<0.001, ****p<0.0001. Data are presented as mean ± SD.

