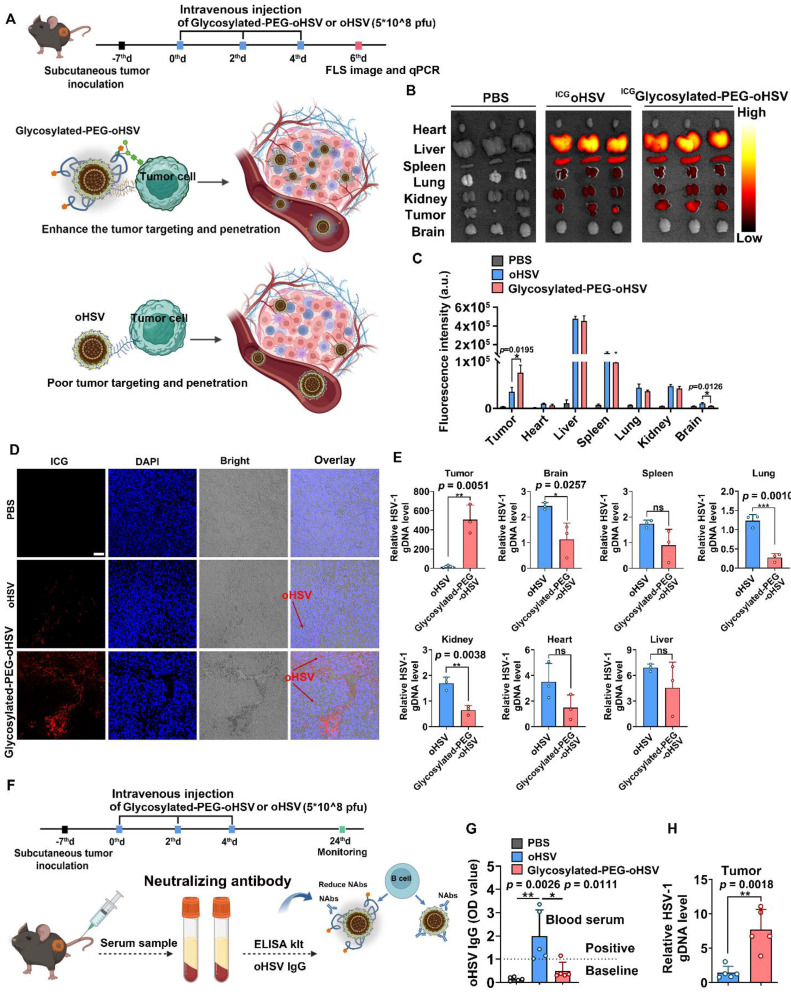
Figure 3.
(A) Schematic illustration of the process of intravenous injection of glycosylated-PEG-oHSV into C57bL/6 mice three times every two days after subcutaneous inoculation of Hepa1-6 tumor cells to evaluate the antitumor effect of glycosylated-PEG-oHSV. (B) and (C) In vivo fluorescence images and intensity of C57bL/6 mice treated with PBS, ICGoHSV, or ICGglycosylated-PEG-oHSV for 48h of injection. (D) CLSM image and distribution of ICG oHSV or ICGglycosylated-PEG-oHSV in tumor tissues after treatments in C57bL/6 mice as indicated, respectively. Scale bar, 50 μM. (E) oHSV genomic DNA levels were measured by RT-qPCR after the indicated treatments in the indicated organs, represented by oHSV gD DNA levels (n = 3; data are shown as means ± SD). (F) and (G) The process of intravenous injection of glycosylated-PEG-oHSV or oHSV three times, and then collection of serum for oHSV IgG analysis and quantification by ELISA kit, (n = 5). (H) oHSV genomic DNA levels in tumors were measured by RT-qPCR after intravenous injection of oHSV or glycosylated-PEG-oHSV (n = 5; data are shown as means ± SD). Statistical analysis was performed using ANOVA analysis, *p<0.05, **p<0.01, ***p<0.001, ****p<0.0001. Data are expressed as mean ± SD.

