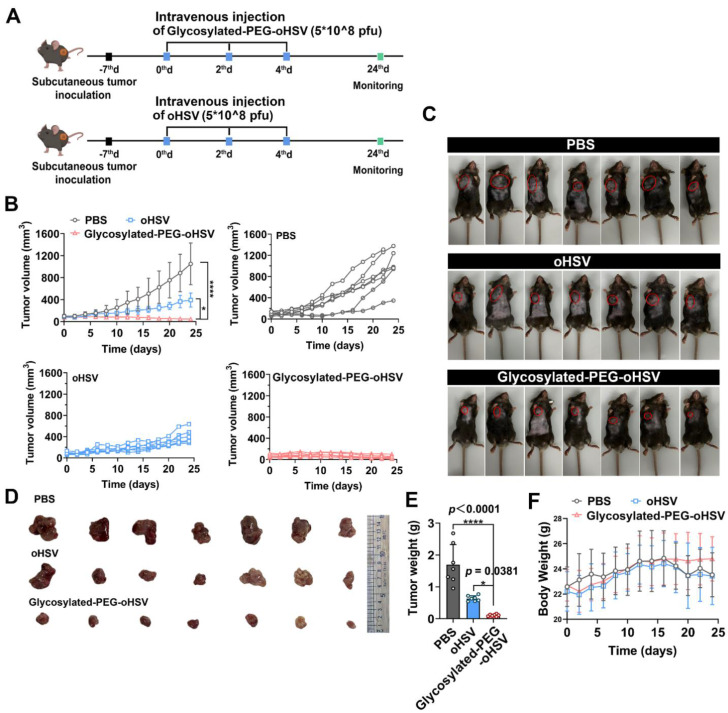
Figure 4.
(A) Schematic illustration of the process of intravenous injection of glycosylated-PEG-oHSV into C57bL/6 mice and its subsequent antitumor effect. (B) Tumor volumes of mice treated with PBS, oHSV, or glycosylated-PEG-oHSV, respectively. (n = 7 mice per group; data are shown as means ± SD). (C) Photomicrograph of mice and (D) ex-tumor after indicated treatments (n = 7). (E) The ex-tumor weights of mice on day 24 after treatment with PBS, oHSV, or glycosylated-PEG-oHSV, respectively, (n = 7). (F) The body weights of mice after treatments as indicated, (n = 7). Statistical analysis was performed using ANOVA analysis, *p<0.05, **p<0.01, ***p<0.001, ****p<0.0001. Data are expressed as mean ± SD, (n = 7).

