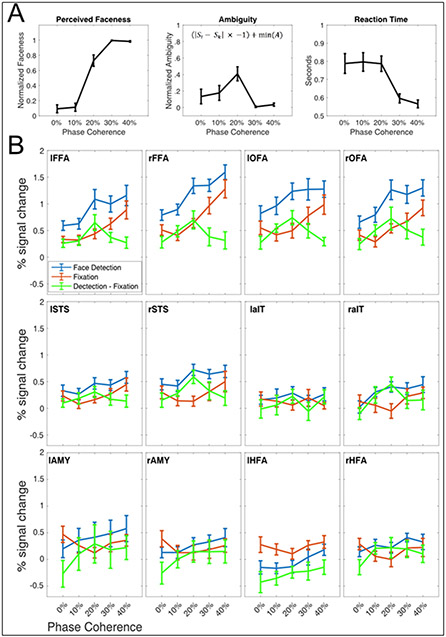
Figure 3.
A) Behavioral Responses to Stimulus Relevant Task. Left panel: The group average of perceived “faceness”, where 0 represents consistently reporting no face, and 1 represents consistently reporting the presence of a face. Central Panel: The group averaged ambiguity curve, showing that stimuli at 20% were most ambiguous, i.e., were most inconsistently categorized. Ambiguity was computed according to the equation shown in the middle panel, where is the ith point of the faceness sigmoid, is the theoretical midpoint of the faceness sigmoid and min(A) is the minimum value of the ambiguity function. Right Panel: Group averaged reaction times during the face detection task. For all panels, error bars represent standard errors across subjects. B) Percent Signal change during event related tasks in all ROIs. In blue, the BOLD responses to the stimulus relevant, domain specific task, in red to the stimulus irrelevant task. For the majority of ROIs, the stimulus relevant BOLD responses are larger across all phase levels relative to the stimulus irrelevant task. The green curve represents the differences between tasks.

