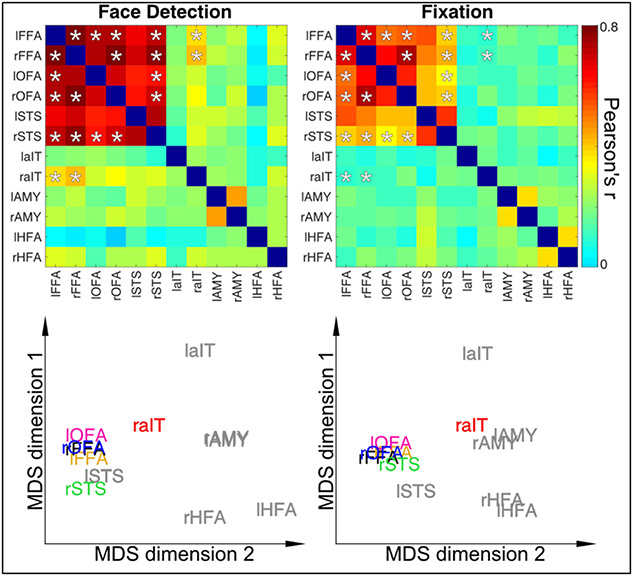
Figure 4.
Dynamic Reconfiguration of Face Network as a function of Task Top Row: Connectivity Matrices for Stimulus Relevant Face Detection Task (Left) and Stimulus Irrelevant Fixation Task (Right). Asterisks indicate correlation coefficients that significantly (p<0.05) difference between tasks and are identical between matrices for visualization purposes. Bottom Row. Classic Multidimensional Scaling for connectivity matrices highlights the higher proximity of the rAIT to the core face areas as a function of increased connectivity during face detection relative to the fixation task. ROIs in grey text indicate those regions with no significant connectivity modulations across tasks.

