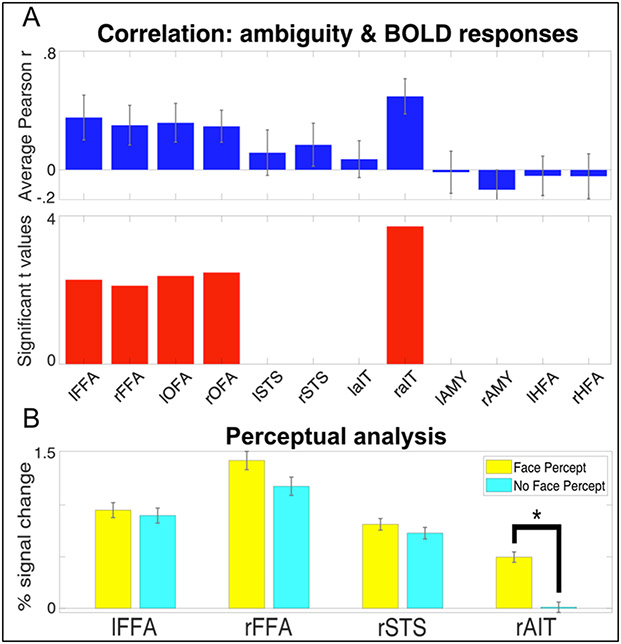
Figure 5.
A) Brain-Behavior Correlations in FFAs, OFAs and rAIT. Top. The Pearson correlation coefficient between the ambiguity score and the difference in task BOLD responses. Bottom. For the regions reaching significance (p<0.05), the left and right FFAs and OFAs, and rAIT, the t values are plotted. B) Average BOLD response to 20% phase coherence (i.e. the most ambiguous stimulus) for the trials in which participants reported a face percept (yellow) and no face percept (magenta). Responses are reported for the regions that showed a significant (p<.05 corrected) task by condition interaction. Star symbol indicates significantly (p<.05 corrected) difference in amplitude.

