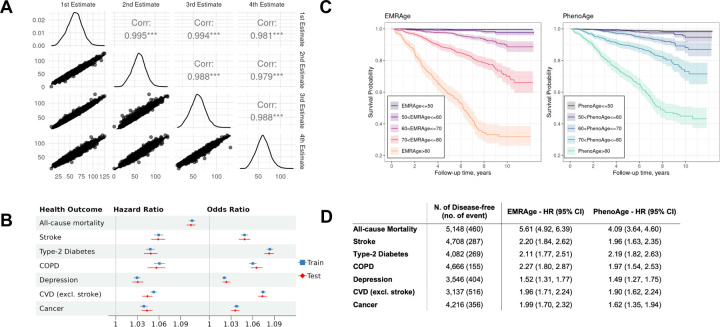
Figure 2. Development, Robustness, and Comparaters of EMRAge.
A) Pairwise correlation between different 4 estimates of EMRAge at timepoints Jan 1st of 2008, 2010, 2012, and 2014. B) Forest plot of hazard ratio and odds ratio between EMRAge and aging-related health outcomes. C) Kaplan-Meier Plot of EMR Age vs. PhenoAge. D) Hazard ratios and confidence intervals of one standard deviation change to onset of aging-related diseases. These values were estimated in the testing dataset from the MGB Cohort (N = 5,148) adjusting for chronological age, sex, race, smoking status, and alcohol consumption.

