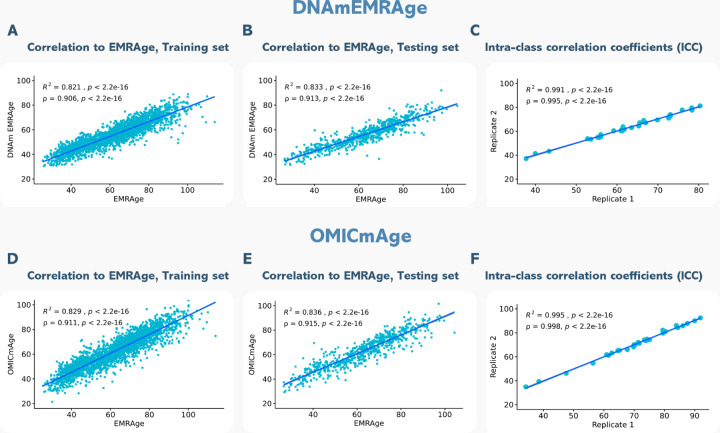
Figure 3. Correlation plots to EMRAge and intra-class correlation coefficients (ICC) for DNAmEMRAge and OMICmAge.
A) Correlation between DNAmEMRAge and EMRAge in the training set (N=2762). B) Correlation between DNAmEMRAge and EMRAge in the testing set (N=689). C) Intra-class correlation coefficients for DNAmEMRAge using 30 replicates. D) Correlation between OMICmAge and EMRAge in the training set (N=2762). E) Correlation between OMICmAge and EMRAge in the testing set (N=689). F) Intra-class correlation coefficients for OMICmAge using 30 replicates.

