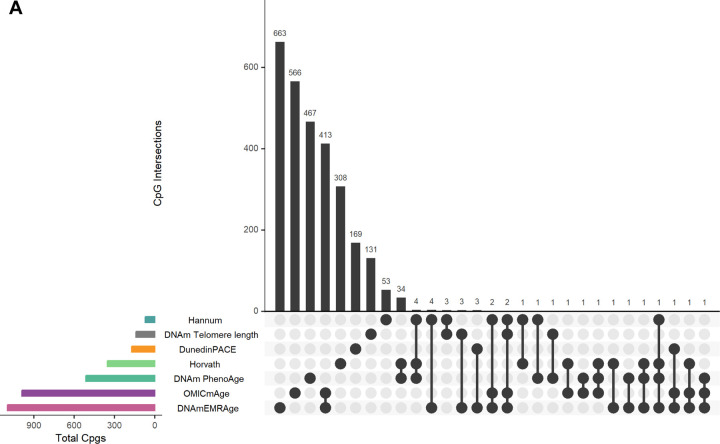
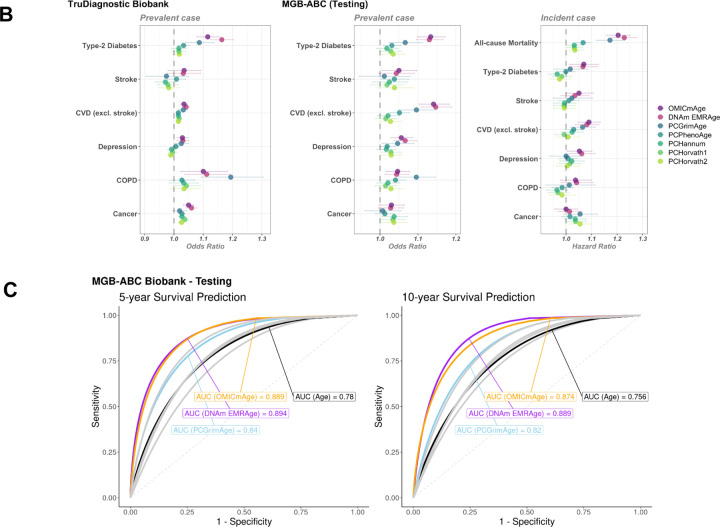
Figure 5. Comparison of OMICmAge and DNAmEMRAge to previously established aging biomarkers.
A) Intersection of predictive CpG sites included in the previously published epigenetic clocks, DNAmEMRAge, and OMICmAge. The horizontal bars represent the total number of CpG sites included in each epigenetic clock. The vertical bars represent the number of unique or shared CpG sites between clocks. PhenoAge refers to the DNA methylation version. B) Horizontal errorbar plot of odds/hazard ratios of each methylation clock to aging-related diseases in TruDiagnostic Biobank cohort or testing set of MGB-ABC cohort. C) ROC curves for 5-year and 10-year survival prediction classifiers utilizing prior methylation clocks or chronological age. The orange line represents OMICmAge, the purple line represents DNAm EMRAge, the light blue line represents PCGrimAge, the remaining grey lines represent other PC aging clocks.


