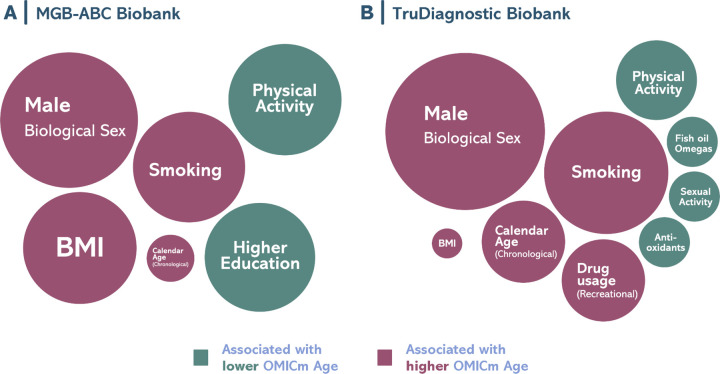
Figure 6. Bubble plot for the representation of the lifestyle factors associated with OMICmAge.
A) MGB-ABC Biobank. B) TruDiagnostic Biobank. Visual representation of the effect sizes found with the OMICmAge. Circle diameter represents the calculated estimated value of the factor. Significant positive associations are represented in green whereas significant negative associations in red. All the associations are adjusted by chronological age, biological sex, ethnicity, body mass index (BMI), and tobacco use.

