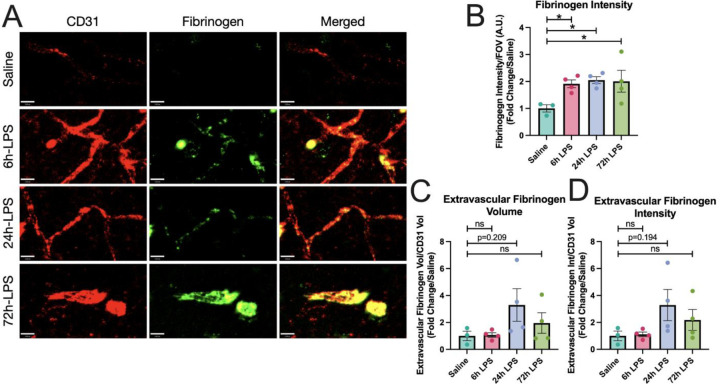
Figure 3: IHC of fibrinogen and CD31 expression in hippocampus after intranasal LPS or saline:
12-week-old C57B/6 mice received intranasal LPS described in Figure 2, followed by sacrifice 24hr after the last dose of LPS or saline. Brains were removed and processed for IF. Red (CD31+), Green (Fibrinogen). Scale bar = 16μm (A). Fibrinogen intensity over intensity over field-of-view (B), Extravascular fibrinogen volume (C) and intensity (D) over CD31+ volume quantified. Values presented as mean ± SEM (saline n=3; 6h LPS n=4; 24h LPS n=4; 72h LPS n=4). **p<0.01, ****p<0.0001. Analyses were performed as One-way ANOVA with post-hoc analysis: p<0.05(*), p<0.01(**), p<0.001(***), p<0.0001(****).

