
Figure 5: Neutrophils engage along the neurovascular endothelium following ALI.
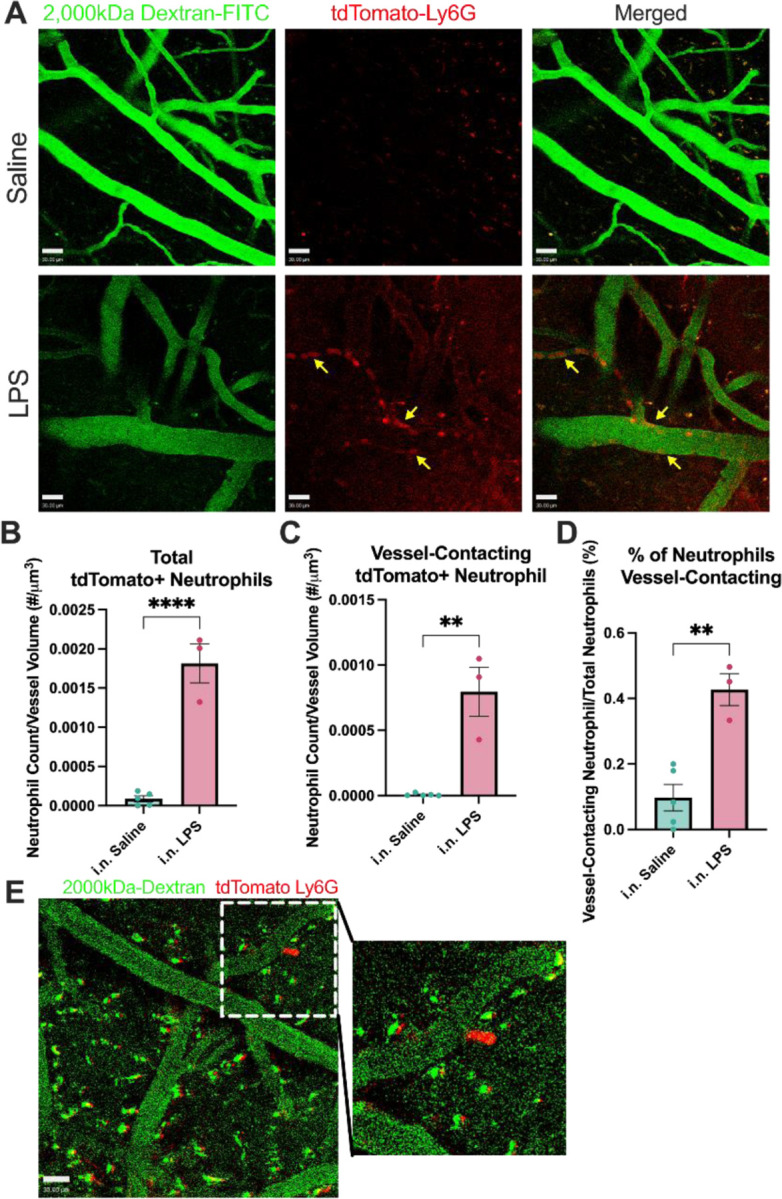
Intravital imaging (2-photon) analysis of fluorescently labeled neutrophils in the somatosensory cortex. 15-week-old Catchup (C57BL/6-Ly6g(tm2621(Cre-tdTomato)Arte)) mice were treated with three doses of intranasal (i.n.) LPS (24h apart for 3 days) and were imaged 24hr after the last dose. Z-stack images were taken sequentially every 4 seconds for 100 images (396 seconds). (A) Representative images of neutrophil engagement to brain endothelium. Arrows represent neutrophil engagement to adluminal surface of vascular endothelium. (B) Quantification of the average number of neutrophils in the field of view per Z-stack image normalized to vascular volume. (C) Quantification of the average number of neutrophils contacting the edge of the dextran+ vessels normalized to vascular volume. (D) Quantification of the percentage of neutrophils engaging with brain endothelium. (E) Representative image of neutrophil extravasation out of brain vasculature into the parenchyma. Green (2000kDa FITC-Dextran), Red (tdTomato-Ly6G). Scale bar = 30μm. Values presented as mean ± SEM (saline n=5; LPS n=3). **p<0.01, ****p<0.0001. Analyses were performed as unpaired t-tests (B-D).