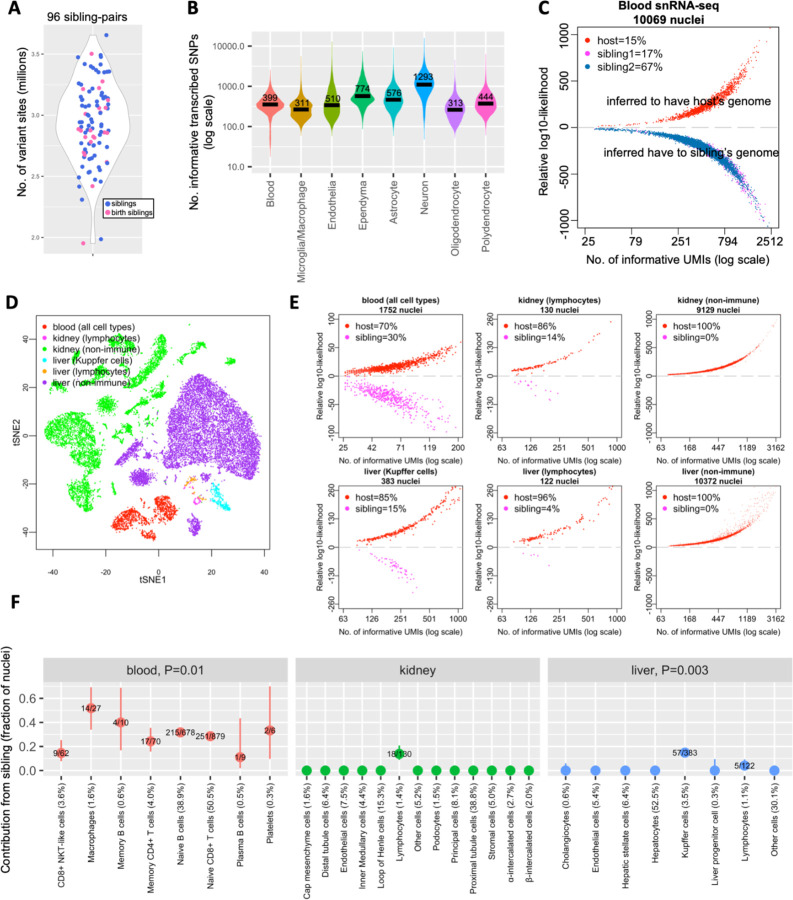
Figure 1. Sibling chimerism analysis at single-cell resolution.
(A) Numbers of variant sites at which marmoset sibling genomes differ, for 96 sibling-pairs. Each dot is a sibling-pair; birth siblings are colored in pink. (B) Numbers of transcribed SNPs (per nucleus) visible in various cell types from blood and brain snRNA-seq datasets of marmoset CJ028. x-axis: snRNA-seq library; y-axis: number of ascertained, transcribed SNPs for which host and sibling have different genotypes; black horizontal lines: median values per cell type. (C) Donor-of-origin assignment of each nucleus in blood snRNA-seq of a marmoset. The host marmoset (CJ028) was born with two siblings; each nucleus was assigned to either the host or to one of the two birth siblings. x-axis: number of unique molecular identifiers (UMI; a measure of transcript abundance) that contains SNPs for which the host and sibling’s genomes differ, in log scale; y-axis: inferred likelihood that the cell has host genome minus likelihood that the cell has sibling genome (log10). (D) Two-dimensional visualization (tSNE plot) of snRNA-seq data from a marmoset’s (CJ026) blood, kidney and liver. (E) Donor-of-origin assignment in marmoset CJ026’s blood, kidney and liver. axes: same as in (C). (F) Levels of chimerism in each cell type ascertained in blood, kidney and liver snRNA-seq of marmoset CJ026. y-axis: fraction of sibling cells in each cell type; numbers in fraction: number of sibling nuclei over total nuclei in the cell type; percentage in x-axis labels: cell type representation in the tissue; vertical bars: binomial confidence interval (95%); P-values: test of heterogeneity (Chi-square) across immune cell types of a tissue (to test for differences in contribution of sibling across immune cell types).

