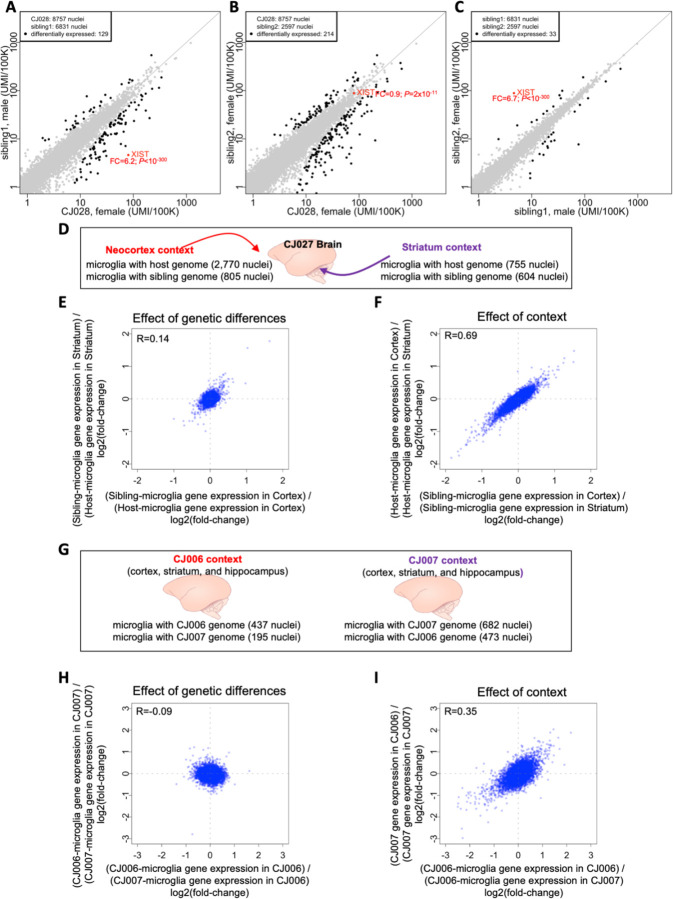
Figure 5. Utilizing natural chimerism to distinguish cell-autonomous from non-cell-autonomous effects on gene expression, and to compare the effects context and genetic variation in shaping gene expression.
(A-C) Comparisons of RNA expression between microglial populations within host animal CJ028, who had two birth siblings. Comparisons of gene expression between microglia with the genomes of (A) the female host and male sibling, (B) the female host and female sibling, and (C) the two siblings (male and female). Each point represents a gene; its location on the plot represents the level of expression of that gene among microglia with two different genomes in the same animal. x- and y-axes: normalized gene expression levels (number of transcripts per 100,000 transcripts). FC: fold-change of gene expression, female/male for XIST. Fold-change and P-values were calculated using edgeR. Differentially expressed genes (black dots) were defined as: FDR Q-value<0.05 and fold-change>1.5 or less than 1/1.5 and the gene must be expressed in at least 10% of one of the microglia sets. (D-I) Higher effect of context than genetic differences in shaping gene expression. (D) In the brain of marmoset CJ027, the neocortex and striatum are two contexts where two sets of microglia with different genomes reside. (E) Effect of genetic differences. x-axis: log2-fold-change of cortical microglia gene expression between host and sibling cells; y-axis: log2-fold-change of striatal microglia gene expression between host and sibling cells. (F) Effect of context. x-axis: log2-fold-change of the sibling’s gene expression between the two brain regions; y-axis: log2-fold-change of the host’s gene expression between the two brain regions. (G-I) The brains (cortex, striatum and hippocampus) of two birth siblings provide biological contexts in which populations of microglia with two sibling genomes reside. The effect of genetic differences (H) and effect of animal context (I) are compared, for the same brain areas (combined data from cortex, striatum and hippocampus). x- and y-axes: log2-fold-changes of the gene expression between two sets of microglia (the sets being compared are indicated in the axis labels). R: Spearman correlation.

