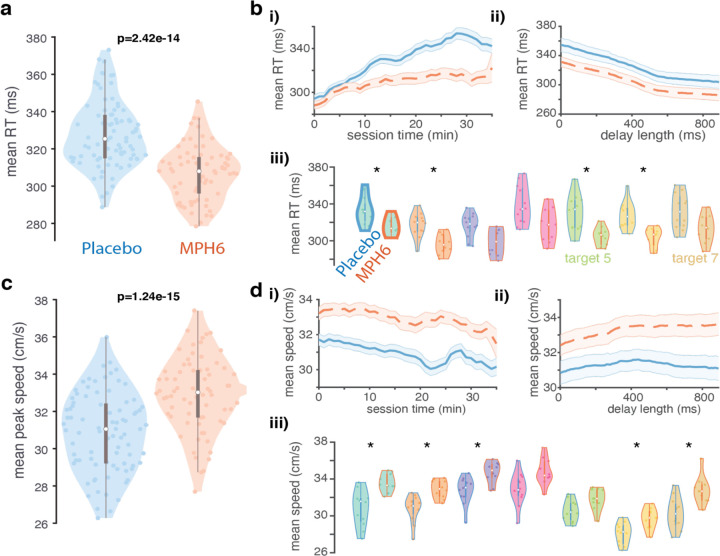
Figure 2: Effects of MPH on reaction times and reach speed (monkey U, 6 mg/kg dose). a) Reaction time distributions across treatments.
Violin plots showing distributions of mean per-session, per-target RTs in each treatment. Each colored data point is the mean RT across all trials to a single reach target in a single MPH (right, orange) or placebo (left, blue) session. Reaction times were calculated offline as the time from go cue until the hand speed reached 5% of its peak value on a given trial. Box-and-whisker plots for each distribution are overlaid in gray. p-values for differences by treatment condition displayed are found by running ANOVAs on per-session, per-target datapoints including treatment and target as grouping variables, as well as their interaction. b) RT over time, trial count, delay, and reach target condition across treatments. i) RT over elapsed session time: moving average of RT across all sessions (orange dashed lines: MPH sessions; blue solid lines: placebo sessions) over increasing per-session elapsed time (in minutes). Session time is truncated to 35min due to limited data in subsequent time windows (secondary to the monkey taking breaks during sessions as well as variability in the overall duration of individual sessions). Error bars: s.e.m. ii) RT by delay duration: mean ± s.e.m. of RT calculated over a sliding window across trials with different delay lengths. iii) RT distributions by reach target. Conventions for each reach target (pair of violin plots with matching fill colors) as in a, except: 1) p-values were found for differences by treatment in the mean per-session RT values for all trials with a given reach target (rank-sum test). Asterisks denote significance at the .05 level after correction for multiple comparisons. 2) Box-and-whisker plots and violin edges are now color coded by treatment condition (orange for MPH and blue for placebo). c) Peak reach speed distributions across treatments. All conventions as in a, except for peak reach speed (also determined on each trial) rather than RT. d) Peak speed over time, trial count, delay, and reach target condition across treatments. Same as b, but for peak reach speed.

