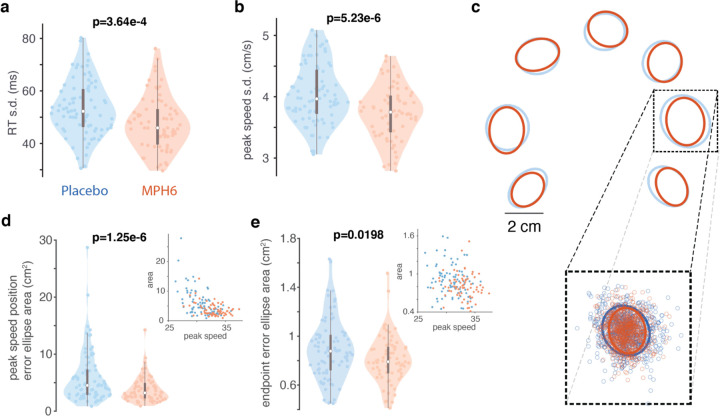
Figure 3: Effects of MPH on reach variability (monkey U, 6 mg/kg dose). a) RT variability across treatments.
Conventions as in Figure 2a, but for distributions of the per-session, per-target standard deviation of the RT in each treatment condition. Each colored data point is the standard deviation of the RT across all trials to a single reach target in a single MPH (right, orange) or placebo (left, blue) session. b) Peak reach speed variability across treatment conditions. Same as a, but for distributions of the per-session, per-target standard deviation of the peak reach speed in each treatment. c-d) Variability of hand position at the time of peak reach speed across treatments. c) Inset shows full distribution of 2D hand positions at the time of peak reach speed on individual trials in all MPH (orange) and placebo (blue) sessions for an example reach target. Small datapoints represent single-trial hand positions. “Error ellipses (EE)” (in blue for placebo sessions and orange for MPH) found with PCA capture 90% of the variance of the distribution for each target37,51,52. d) Distributions (by treatment) of the per-session, per-target variability of the hand position at peak speed. Plotting conventions and statistics (ANOVA) as in previous figures. Variability was measured using EE area determined as in a for the distribution of single-trial hand positions for reaches to each target, except on a per-session basis. Each colored data point is the area of the 90% EE fit to the single-trial distributions of hand position at peak speed for all trials to a single reach target in a single MPH session (right, orange), or an associated placebo session (left, blue). Insets: scatter plots of EE area and peak speed (1 data point per session per target; orange: MPH sessions). e) Variability of reach endpoint position across treatments. Same as d, but for distributions of 2D hand positions at the endpoint of each reach. Distributions (by treatment) of the per-session, per-target variability of reach endpoint position. Inset: scatter plot of EE area and peak speed (per session per target; orange: MPH).

