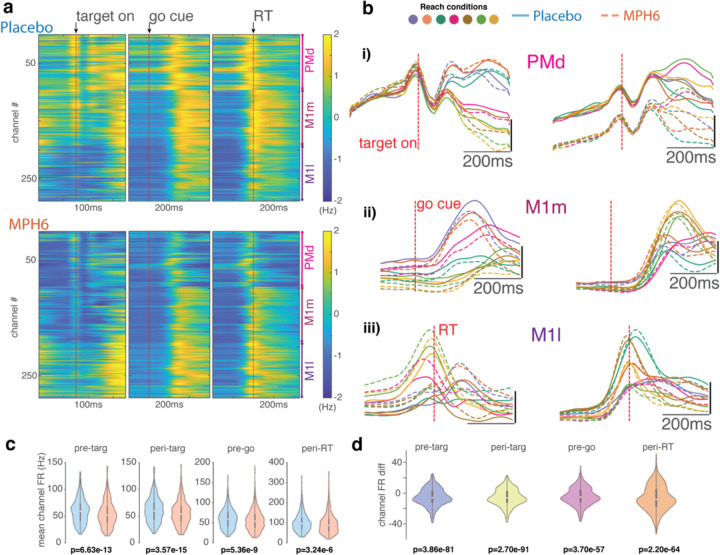
Figure 4: Effects of MPH on motor cortical firing rates (monkey U, 6 mg/kg dose).
a-e) FR differences across treatment conditions. a) FR heatmaps, z-scored across treatments. Average FRs for each channel (collapsed across all reach targets), z-scored across time and treatment conditions, aligned to key trial epochs around target onset, go cue, and RT). Top, placebo sessions; bottom, MPH. b) Peri-stimulus time histograms (PSTHs) of representative channels calculated across all MPH sessions (dashed lines) and all placebo sessions (solid lines). Colors code for the same reach targets as in prior figures. i) Two example PMd channels with activity aligned to target onset. ii) Go-cue-aligned PSTHs from two M1m channels. iii) RT-aligned PSTHs from two M1l channels. c) Distribution of mean single-channel PSTH values across all time points in each of four trial epochs (see Methods for exact time windows). One data point per channel per reach target. Box-and-whisker plots overlaid in gray. p-values across all channels were determined using ANOVA with treatment and reach target as grouping variables (and their interaction term). d) Distribution of single-channel mean condition-averaged FR differences by treatment across all time points in the epochs from d (difference: mean FR for a single channel and a single reach condition across all trials in MPH sessions minus mean FR from all trials in placebo sessions). Box-and-whisker plots overlaid in gray. P-values here are from Wilcoxon signed rank test.

