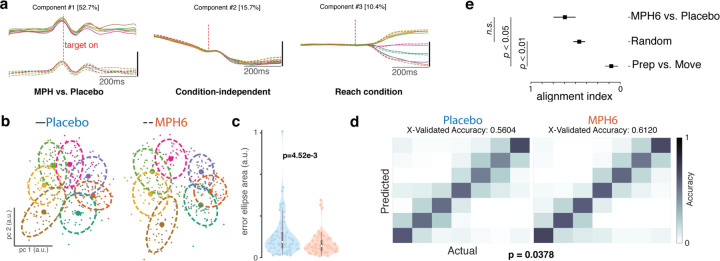
Figure 5: Effects of MPH on motor cortical preparatory activity (monkey U, 6 mg/kg dose).
a) Demixed principal components analysis (dPCA) of U6 data around target onset: top 5 dPCs. dPCA was performed on smoothed FRs aligned to target onset from a concatenated dataset with all MPH and placebo sessions, for visualization only. dPCA was fit and figure generated using code from 55. Left: component varying by treatment (MPH vs. placebo); middle: condition-independent component; right: component varying by reach target. Percentage of variance explained by each dPC is shown in brackets. b-c) Preparatory activity variability across treatment conditions. b) Example distributions of single-trial preparatory neural states found using PCA37,43 for each reach target (colors) for single sessions in the U6 dataset. Left: representative placebo session; right: representative MPH session. For each target, small datapoints represent single-trial preparatory neural states in the top two preparatory PCs. Large datapoints represent the centroid, and dashed lines the overlying “error ellipses (EE)” found with PCA and scaled to capture 70% of the variance of the distribution37. c) Distributions (by treatment) of the per-session, per-target variability of the preparatory neural state. Violin plot plotting conventions and statistics (ANOVA) as in previous figures. Variability was measured using EE area determined as in b) for the distribution of single-trial projections into PC space. Each colored data point is the area of the 70% EE fit to the single-trial PC1–2 projections for all trials to a single reach target in a single MPH session (right, orange) at a given dose, or an associated placebo session (left, blue). d) Discrete reach target decoding from preparatory activity across treatment conditions. Gaussian naïve Bayes classification of reach target from raw preparatory activity across all recorded channels. Cross-validated classification56 was performed separately for each experimental session. Left: classification matrix showing the mean classifier performance across U6 placebo sessions. Colors represent the correlation across trials between the actual target (columns) and the classifier’s predictions (rows). Perfect classification would correspond to ones (yellow) along the diagonal and zeros (dark blue) everywhere else, for a total accuracy of 1. Right: Same as left panel, but for MPH sessions. e) Alignment index. The alignment index was computed (as described in 34) for three different conditions. The bar labeled ‘Prep vs. Move’ corresponds to the preparatory and movement epochs for the MPH data (previously34 shown to be orthogonal, i.e., an alignment index value close to zero). The bar labeled ‘Random’ refers to the distribution of indices expected from randomly drawn dimensions from the space occupied by the MPH and placebo data. Finally, the ‘MPH6 vs. Placebo’ bar denotes the alignment index between the preparatory space determined from the MPH and placebo datasets. The error bars for ‘random’ denote 95% confidence interval based on the distribution obtained via bootstrap. The error bars for the other conditions were computed by performing the analysis on a session-by-session basis. To compute the preparatory dimensions, we considered 300ms of time starting 150ms after the onset of the target. The movement dimensions were computed by considering 300ms of time starting 50ms before the onset of the movement, which is an epoch when muscle activity approximately begins to change.

