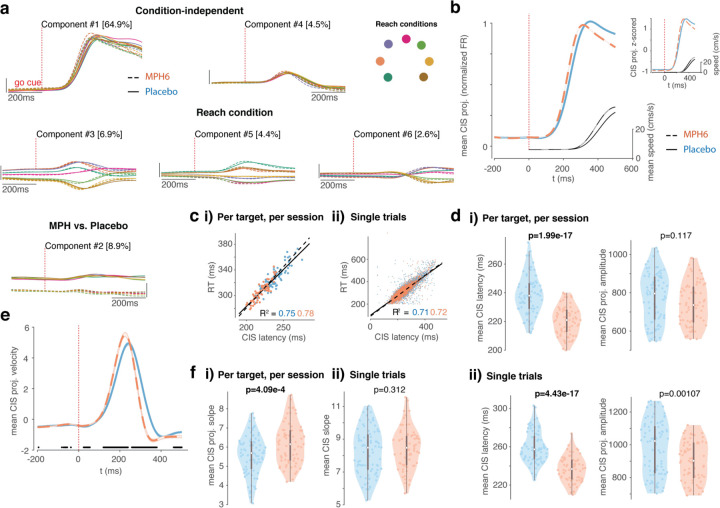
Figure 6: Effects of MPH on motor cortical activity at reach initiation (monkey U, 6 mg/kg dose).
a) Demixed principal components analysis (dPCA) of U6 data around target onset: top 6 dPCs. Analysis and plotting conventions similar to Figure 5a, except that dPCA was fit on smoothed FRs aligned to go cue. Top: condition-independent components; middle: components varying by reach target; bottom: components varying by treatment. Percentage of variance explained by each dPC is shown in brackets. b-f) Condition-invariant signal (CIS) across treatment conditions. b) Mean (± s.e.m.) of projections along the CIS 38; the first condition-invariant component, from dPCA fit separately for each treatment) aligned to go cue. Plotting conventions as in Figure 4. Inset in the upper right is from the same data but instead shows the z-scored mean CIS projection for each treatment (normalized amplitude). c) CIS correlation with reaction time (RT). i) Correlation between latency of condition-averaged CIS projections and RTs (one data point per session per target). Orange dots and dashed line of best fit correspond to MPH sessions, blue dots and solid line to placebo. ii) As in i, but for single trials. d) CIS latency and amplitude across treatments. i) Left: Violin plots showing distributions of mean per-session, per-target CIS latencies calculated using condition-averaged trajectories (mean CIS projection per target per session) (the time post-go-cue that the CIS projection reached 50% of its peak on individual trials). Plotting and statistics conventions as in previous figures. Right: Same as left, but for CIS projection amplitude. ii) Same as i), except for CIS latencies (left) and amplitudes (right) calculated on a single-trial basis (each data point is the mean single-trial metric across all trials to a given reach target in a given session). e-f) CIS rate of rise across treatments. e) Mean velocity (± s.e.m.) of projections along the CIS aligned to go cue, smoothed for visualization only. Plotting conventions as in b. Black dots along the x-axis denote time points at which the MPH and placebo velocity traces significantly differ (false detection rate 0.05). f) CIS slope across treatments. i) Violin plots showing distributions of slopes fit to ramping single-session, condition-averaged CIS projections in the 20ms window centered midway to peak (one data point per session per reach target). Plotting and statistics conventions as in d. ii) Same as i, but for distributions of mean per-session, per target CIS ramp slopes calculated on single trials.

