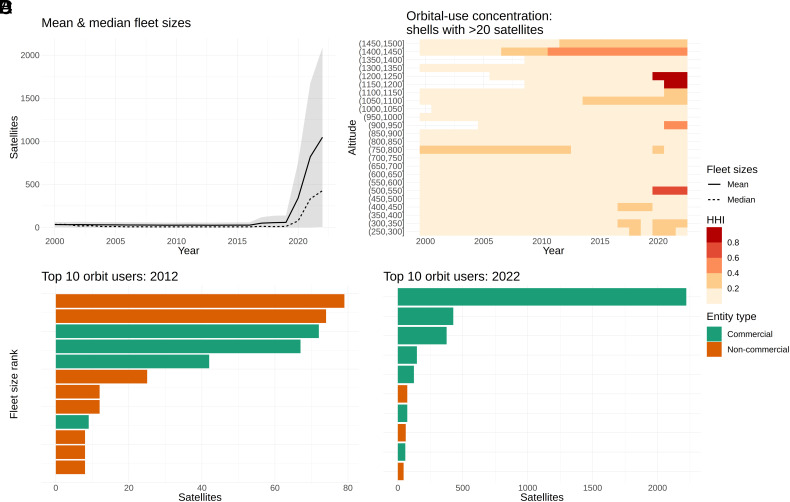
Fig. 1.
State of orbit use over 2000–2022. (A) Growth of average (dotted) and median (solid) satellite fleet sizes across operators (active satellites only). Shaded areas show the average fleet size 1 standard deviation. (B) Herfindahl–Hirschman index (HHI) for active satellite ownership in 50-km orbital shells. The HHI is a standard economic measure of concentration used in competitive and antitrust analysis, computed as the squared share of objects in a shell owned by a single entity (38). Higher numbers indicate that a larger share is owned by a smaller number of actors. Shells with fewer than 20 satellites (10th percentile) are truncated to zero for visualization. (C) Top ten operators by active satellite count in 2012. “Noncommercial” entities include civil government, military, and amateur operators. (D) Top ten operators by active satellite count in 2022. Data compiled from refs. 2 and 3.

