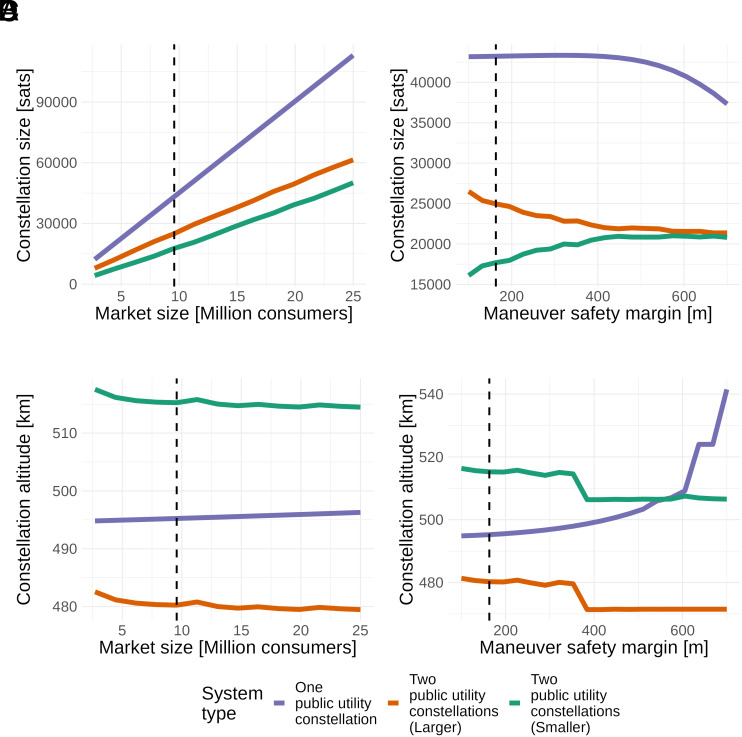
Fig. 3.
Public utility constellation sizes and locations as number of consumers served and safety margin increase. (A and B) show the constellation size changes related to the number of consumers served and safety margin increase. (C and D) show the location changes related to the number of consumers served and safety margin increase. The dashed vertical lines show the benchmark calibration. Irregularities in the two-constellation problem’s optimization surface introduce numerical artifacts in the solution paths.

