Fig. 4.
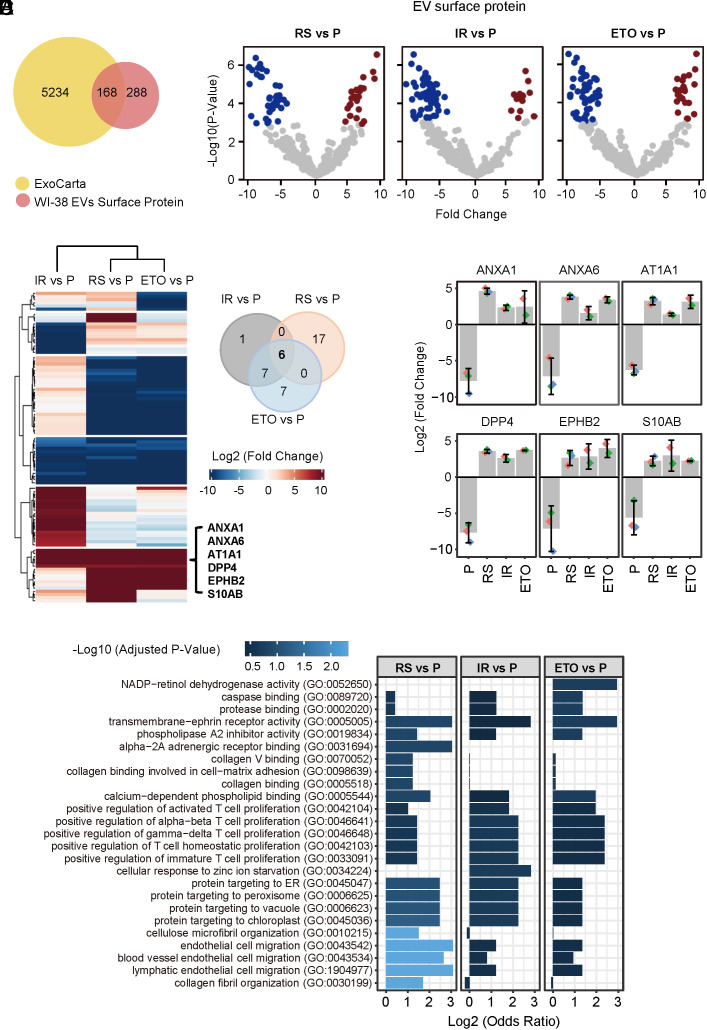
Mass spectrometry profiling of surfaceome of EVs from proliferating and senescent fibroblasts. (A) Venn diagram of proteins (456 total) identified in the surfaces of EV samples from all four groups combined (P, RS, IR, and ETO) compared with proteins annotated in the ExoCarta databases (5,402 proteins). (B) Volcano plot of proteins differentially abundant on the surface of EVs from proliferating (P) fibroblasts relative to the surface of EVs from fibroblasts rendered senescent (S) by RS, IR, or ETO. (C) Left, heatmap of proteins differentially abundant on the surface of EVs from proliferating (P) fibroblasts relative to the surface of EVs from fibroblasts rendered senescent (S) by RS, IR, or ETO. Right, Venn diagram indicating the six proteins enriched on the surface of EVs from all three senescent paradigms compared with EVs from proliferating fibroblasts. (D) Bar graph depicting the abundance of the 6 specific proteins (ANXA1, ANXA6, AT1A1, DPP4, EPHB2, and S10AB) on the surface of S-EVs [prepared from S (RS, IR, ETO) cells] compared with P-EVs (prepared from P cells), as measured by proteomic analysis. (E) Gene Ontology enrichment analysis of the proteins preferentially abundant on the surface of EVs from S fibroblasts (RS, IR, and ETO) compared with EVs from P fibroblasts.

