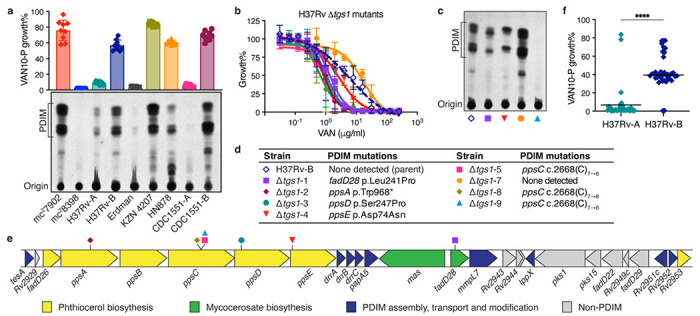
Fig. 2 |. VAN-P assays accurately predict PDIM status during genetic manipulations and across different Mtb strains and lineages.

a, TLC lipid analysis and VAN10-P assays of different laboratory stocks of virulent Mtb strains alongside Mtb mc27902 and mc28398. Mean ± SD for n = 9 pairwise comparisons between triplicate wells. b, VAN-P MIC assays of eight Δtgs1 mutants and the parent H37Rv-B. Mean ± SD for n = 3–4 biological replicates from two independent experiments. c, TLC lipid analysis of four Δtgs1 mutants and H37Rv-B. Lipid extracts in (a) and (c) were run on the same TLC plate. d, Mutations in PDIM biosynthetic genes of Δtgs1 mutants (see also Extended Data Fig. 5). e, Schematic showing the PDIM gene cluster and location of secondary PDIM mutations in Δtgs1 mutants. f, VAN10-P screening of single colonies isolated from H37Rv-A (n = 38) and H37Rv-B (n = 37). Each colony was assayed in triplicate and data points represent mean VAN10-P growth%. Lines indicate the median. ****P < 0.0001; unpaired two-tailed Mann-Whitney test.
