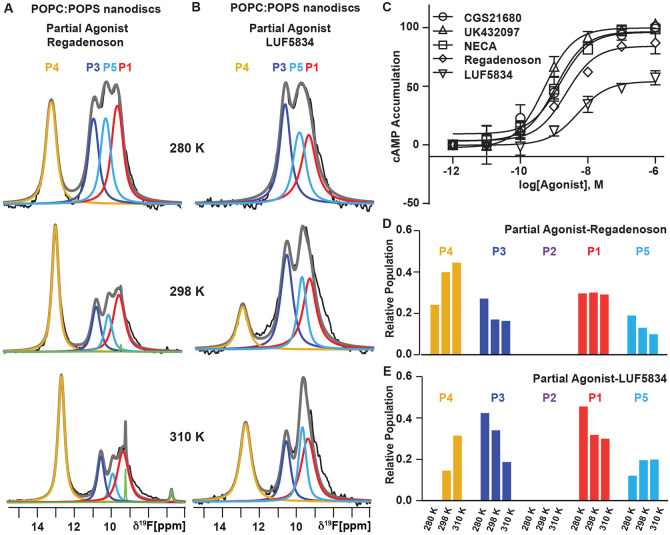
Figure 2. Variable temperature 19F-NMR observed ensembles for complexes with partial agonists of differing efficacy.
(A and B) 19F-NMR spectra of A2AAR[A289CTET] in lipid nanodiscs containing POPC:POPS (70:30 molar ratio) recorded at three temperatures for complexes with the partial agonists (A) Regadenoson and (B) LUF5834. The fit for the unique population observed for the partial agonist complexes is shown by the cyan line. Other figure presentation details the same as in Figure 1.
(C) cAMP accumulation experiments upon stimulation of A2AAR with full and partial agonists. Data are shown as the means ± standard error of mean (s.e.m.) for three independent experiments. The EC50 values are 1.52 nM, 1.14 nM, 0.52 nM, 5.14 nM, and 2.26 nM for CGS21680, NECA, UK432097, LUF5834, and Regadenoson, respectively. The Emax values were 101%, 100%, 103%, 57%, and 87% for CGS21680, NECA, UK432097, LUF5834, and Regadenoson, respectively.
(D and E) Relative populations of each state over the range of studied temperatures determined from the fitted data shown in A and B in a bar chart format for A2AAR in complex with the partial agonist (D) Regadenoson and (E) LUF5834.
See also Figures S1 - S3 and Table S1.

