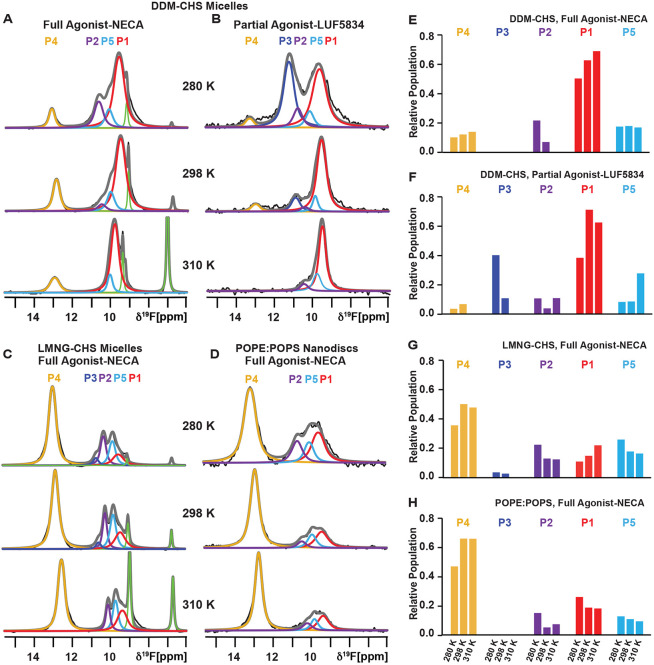
Figure 3. Comparison of the variation in temperature observed for the conformational equilibria of A2AAR[A289CTET] in three different membrane mimetics.
(A and B) Variable temperature 19F-NMR spectra of A2AAR[A289CTET] reconstituted in DDM-CHS micelles in complex with the (A) agonist NECA and (B) partial agonist LUF5834. Other figure presentation details are same as in Figures 1 and 2.
(C) Variable temperature 19F-NMR spectra of A2AAR[A289CTET] in complex with the agonist NECA reconstituted in LMNG-CHS micelles. Other figure presentation details are same as in Figures 1 and 2.
(D) Variable temperature 19F-NMR spectra of A2AAR[A289CTET] in complex with the agonist NECA reconstituted in POPE:POPS (70:30 molar ratio). Other figure presentation details are same as in Figures 1 and 2.
(E – H) Relative populations of each state over the range of studied temperatures determined from the fitted data shown in A – D represented in a bar chart format for A2AAR reconstituted in DDM-CHS micelles, in complex with the (E) agonist NECA and (F) partial agonist LUF5834, and A2AAR in complex with the agonist NECA reconstituted in (G) LMNG-CHS micelles and (H) lipid nanodiscs containing POPE:POPS (70:30 molar ratio).
See also Figures S1 - S4 and Table S1.

