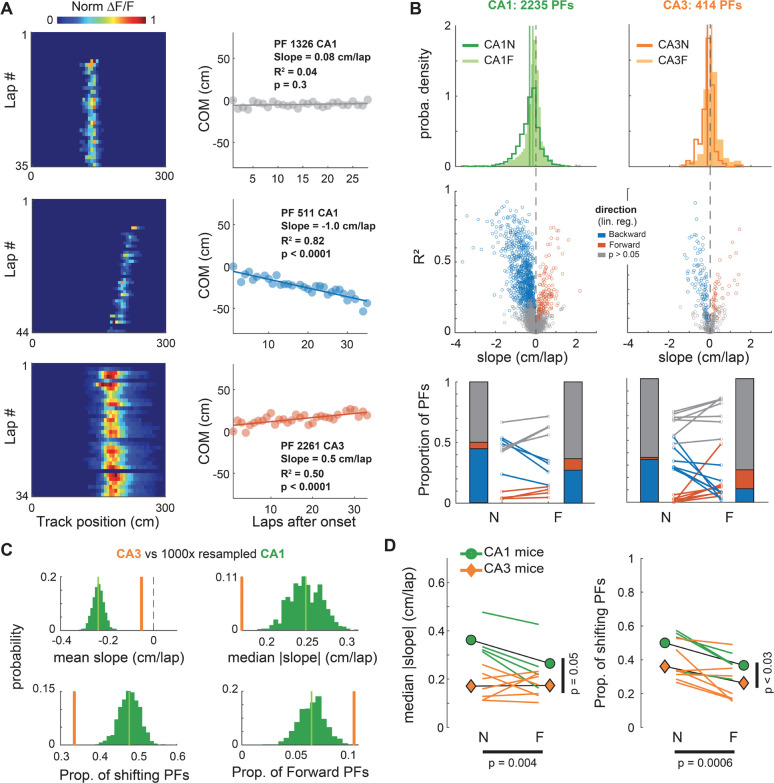
Figure 1. Linear shifting of place-fields decreases with familiarity and differs between CA1 and CA3.
A. Left: Examples of CA1 and CA3 place-fields (PFs) recorded using 2-photon calcium imaging. Right: Linear regression on the onset-centered PF Center of Mass (COM) was used to classify each PF as shifting backward (blue), forward (red) or not significantly shifting (grey).
B. Characterization of PF linear shifting in CA1 (left) and CA3 (right) for PFs defined over a span of at least 15 laps. Top: Probability density distributions of slopes (i.e. shifting speeds) for all PFs in CA1 and CA3 during navigation along a novel (N) or familiar (F) virtual track (CA1N: 1167 PFs, CA1F: 1068 PFs, CA3N: 235 PFs, CA3F: 179 PFs). Middle: estimated shifting speed vs linear regression fit (R2) for individual PFs. Bottom: Lines correspond to individual mice, stacked bars to averages across mice (n = 4 for CA1, 7 for CA3. Paired t-tests: CA1 N vs F backward: t(3) = −4.5, p = 0.020, forward: t(3) = 3, p = 0.057; CA3 N vs F backward: t(6) = −3.9, p = 0.008, forward: t(6) = 2.4, p = 0.051).
C. Resampling exact tests controlling for the sample size difference between CA1 and CA3. 414 of the 2235 CA1 PFs were randomly resampled 1000 times to match CA3. The CA3 value was outside the resampled distribution for all statistics (green distribution).
D. Animal-wise statistical tests (colored lines are individual mice, symbols are averages across mice). ANOVAs with repeated measures based on linear mixed effects models show effects of both the recorded subfield (CA1 vs CA3) and the environment familiarity (N vs F) on the proportion and speed of PF shifting. Left: Median Absolute Slope ~ 1 + Subfield * Familiarity + (1 + Familiarity | Mice): Subfield: F(1,18) = 4.27, p = 0.053; Familiarity: F(1,18) = 11.14, p = 0.0037; Interaction: F(1,18) = 7.5, p = 0.013. Because the interaction was significant, we performed post-hoc paired t-tests with Bonferroni corrections for 4 comparisons: CA1N vs CA3N p = 0.0047, CA1N vs CA1F p = 0.078, CA1F vs CA3F p = 0.37, CA3N vs CA3F p = 1. Right: Proportion of shifting PFs ~ 1 + Subfield + Familiarity + (1 + Familiarity | Mice): Subfield: F(1,19) = 5.59, p = 0.029; Familiarity: F(1,19) = 16.77, p = 0.0006; The interaction was excluded because it was not significant.

