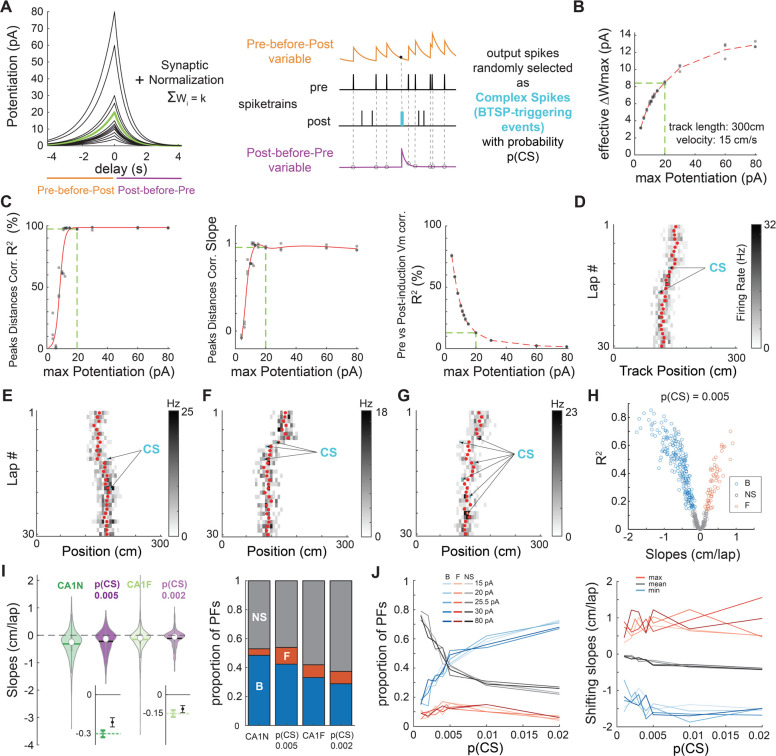
Figure 3. BTSP explains PF shifting in CA1.
A. Left: Plasticity rules tested in B-C. The green kernel corresponds to the BTSP rule used in D-J. Right: Implementation of plasticity adapted from our STDP model.
B-C. To determine a plausible maximum potentiation parameter for the BTSP rule, we tested different amplitudes (shown in A) in “Milstein-type” in-silico experiments as described in Fig. S11 (3 experiments per condition).
B. Effective maximum weight change resulting from the combination of homeostatic plasticity and each potentiation rule in A. Estimated as in Fig S10H. The green dashed line corresponds to the green kernel in A.
C. Optimization of the BTSP maximum potentiation parameter to fit Milstein et al. (2021)’s experimental findings (see Fig S10). The green dashed line indicates the optimal BTSP amplitude (minimal parameter value that maximizes the first 2 indicators and for which the third indicator is optimally low).
D-G. Examples of 30-lap simulations of our place cell model (as in Fig. 2A) with plastic synapses following the optimized homeostatic BTSP rule (green kernel in A). Depending on the number and location of CSs (arrows), the COM trajectory (red dots) can go backward (D, F) or forward (E) and appear somewhat smooth and linear (D) or display abrupt shifts and changes of direction (G).
H. Simulation of 500 PFs using p(CS) = 0.005. The distribution of backward, forward and non-significantly shifting PFs (assessed by linear regression of the COM as before) is reminiscent of CA1 (compare to Fig 1B).
I. Comparison of the CA1 data (dark and light green, same as in Fig 1) with 2 versions of the model where only p(CS) was changed (dark and light purple). Left: Violin plots of the shifts distributions (median is open circle, mean is solid line). The models (500 simulated PFs each) cannot reproduce the most extreme shifts, but the variances are comparable to CA1. Insets on the bottom show bootstrapped means and 95% CI (small but significant difference between the model and CA1N, not significant for CA1F). Right: Proportions of backward (B, blue), forward (F, red) and non-significantly (NS, grey) shifting PFs. The models qualitatively match the data.
J. Exploration of the parameter space: p(CS) and BTSP amplitude (maximum potentiation before synaptic normalization) were varied systematically. 100 simulations per condition. Left: Proportions of backward (blue), forward (red) and non-significantly (grey) shifting PFs. Right: minimum, mean and maximum shifts. The mean shift monotonically but only slightly decreases with p(CS) due to larger proportions of backward shifting PFs, not by inducing larger shifts.

