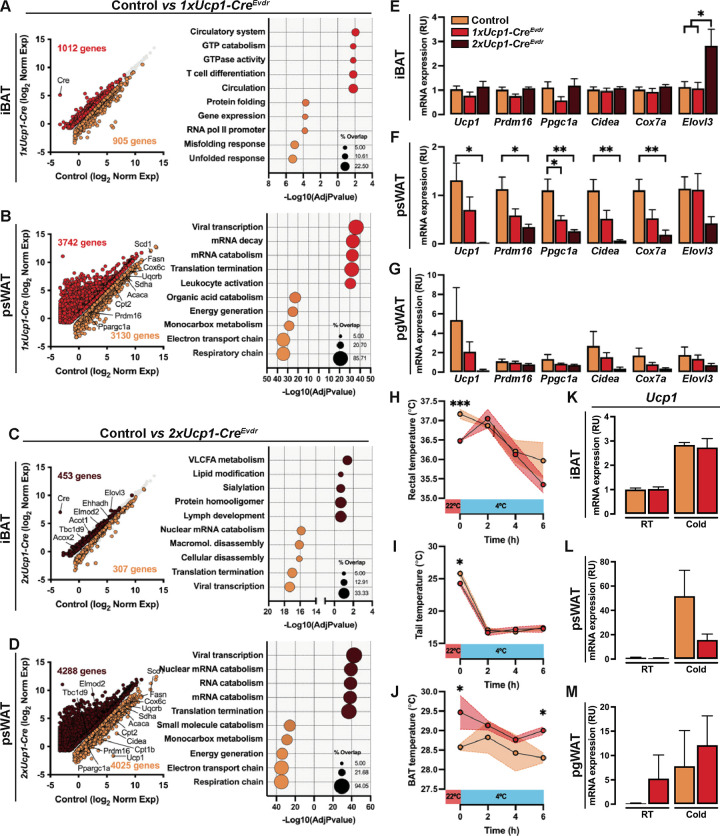
Figure 3:
(A) RNA-seq comparing female control and 1xUcp1-CreEvdr iBAT gene expression (left). Each dot represents one gene. Corresponding GO analysis (right). Genes and pathways significantly enriched in controls are labeled in orange and those enriched in 1xUcp1-CreEvdr are labeled in red.
(B) RNA-seq comparing female control and 1xUcp1-CreEvdr psWAT gene expression (left). Each dot represents one gene. Corresponding GO analysis (right). Genes and pathways significantly enriched in controls are labeled in orange and those enriched in 1xUcp1-CreEvdr are labeled in red.
(C) RNA-seq comparing female control and 2xUcp1-CreEvdr iBAT gene expression (left). Each dot represents one gene. Corresponding GO analysis (right). Genes and pathways significantly enriched in controls are labeled in orange and those enriched in 2xUcp1-CreEvdr are labeled in brown.
(D) RNA-seq comparing female control and 2xUcp1-CreEvdr psWAT gene expression (left). Each dot represents one gene. Corresponding GO analysis (right). Genes and pathways significantly enriched in controls are labeled in orange and those enriched in 2xUcp1-CreEvdr are labeled in brown.
(E) qPCR analysis of iBAT of control, 1xUcp1-CreEvdr and 2xUcp1-CreEvdr females at 6 weeks of age. n= 6.
(F) qPCR analysis of psWAT of control, 1xUcp1-CreEvdr and 2xUcp1-CreEvdr females at 6 weeks of age. n= 6.
(G) qPCR analysis of pgWAT of control, 1xUcp1-CreEvdr and 2xUcp1-CreEvdr females at 6 weeks of age. n= 6.
(H) Rectal temperature of control and 1xUcp1-CreEvdr females undergoing acute cold challenge. n= 3 controls, 4 1xUcp1-CreEvdr. Statistical significance was calculated using unpaired t-test within timepoint.
(I) Tail temperature of control and 1xUcp1-CreEvdr females undergoing acute cold challenge. n= 3 controls, 4 1xUcp1-CreEvdr. Statistical significance was calculated using unpaired t-test within timepoint.
(J) BAT temperature of control and 1xUcp1-CreEvdr females undergoing acute cold challenge. n= 3 controls, 4 1xUcp1-CreEvdr. Statistical significance was calculated using unpaired t-test within timepoint.
(K) qPCR analysis of iBAT of control and 1xUcp1-CreEvdr females after cold challenge or maintained at room temperature. n= 3. Statistical significance was calculated using unpaired t-test between room temperature (RT) and cold samples.
(L) qPCR analysis of psWAT of control and 1xUcp1-CreEvdr females after cold challenge or maintained at room temperature. n= 3. Statistical significance was calculated using unpaired t-test between room temperature (RT) and cold samples.
(M) qPCR analysis of pgWAT of control and 1xUcp1-CreEvdr females after cold challenge or maintained at room temperature. n= 3. Statistical significance was calculated using unpaired t-test between room temperature (RT) and cold samples.
Unless otherwise noted, data are mean + SEM and statistical significance was calculated using one-way ANOVA followed by Tukey’s multiple comparisons test. *P < 0.05, **P < 0.01, ***P < 0.001. For RNA-seq, differential genes were selected by false discovery rate (FDR) < 0.05 with no fold-change cut-off.

