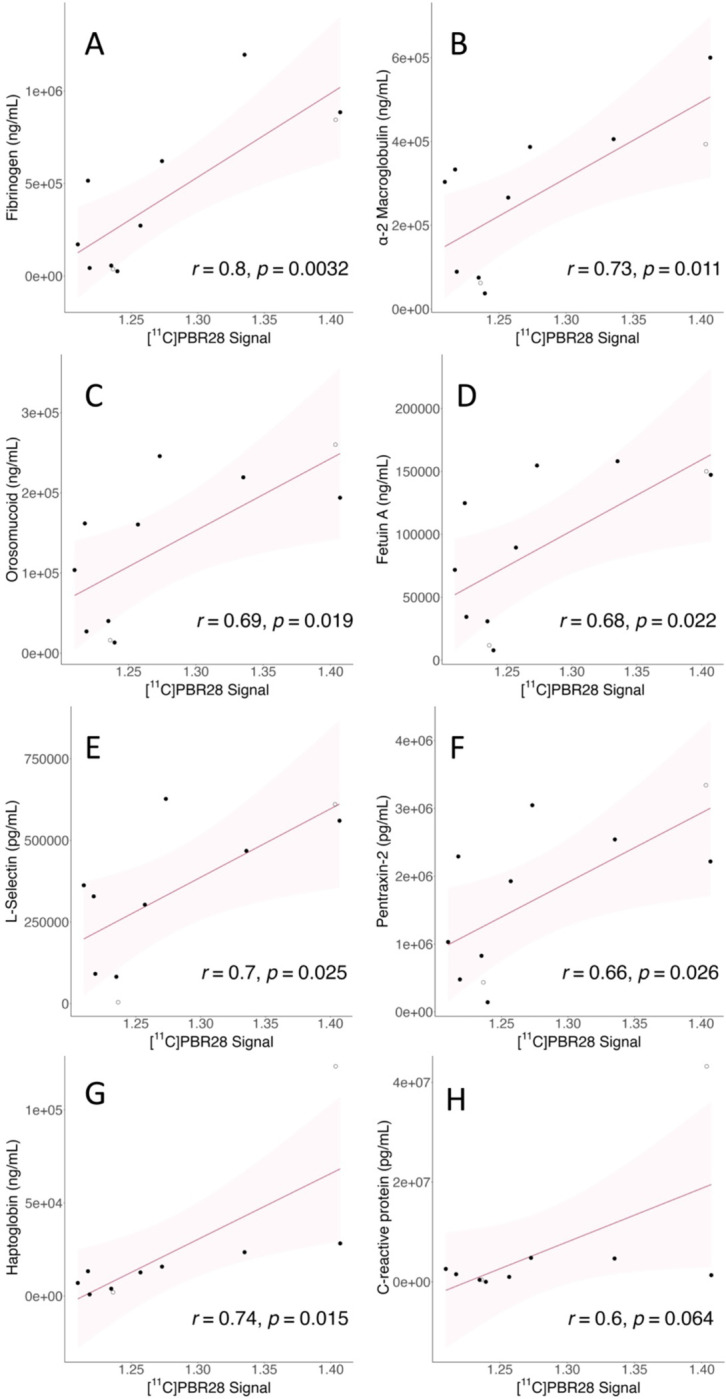
Figure 2.

Correlations between vascular health analytes and PET signal. Y-axis shows analyte concentration; units vary. X-axis shows mean PET SUVR values extracted from the whole-brain significant cluster of each individual. Shadow represents the 95% confidence interval, all p-values are reported two-tailed. See Box 1 for analyte descriptions and Table 2 for Pearson’s r values.
a. Fibrinogen; b. α-2 macroglobulin; c. Orosomucoid; d. Fetuin A; e. sL-selectin; f. Pentraxin-2; g. Haptoglobin; h. C-reactive protein
