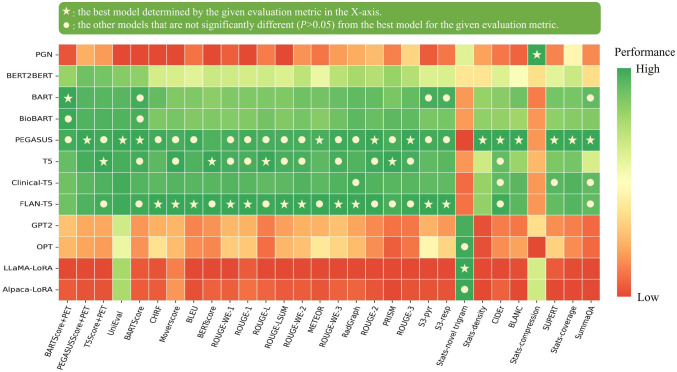
Figure 3:
Performance of 12 language models evaluated by the metrics included in this study. The X-axis displays the metrics arranged in descending order of correlation with physician preferences, with higher correlations on the left and lower correlations on the right. For each evaluation metric, values underwent min-max normalization to allow comparison within a single plot. The actual metric values are referenced in Appendix S7. The star denotes the best model for each metric, and the circle denotes the other models that do not have statistically significant difference (P >0.05) with the best model.

