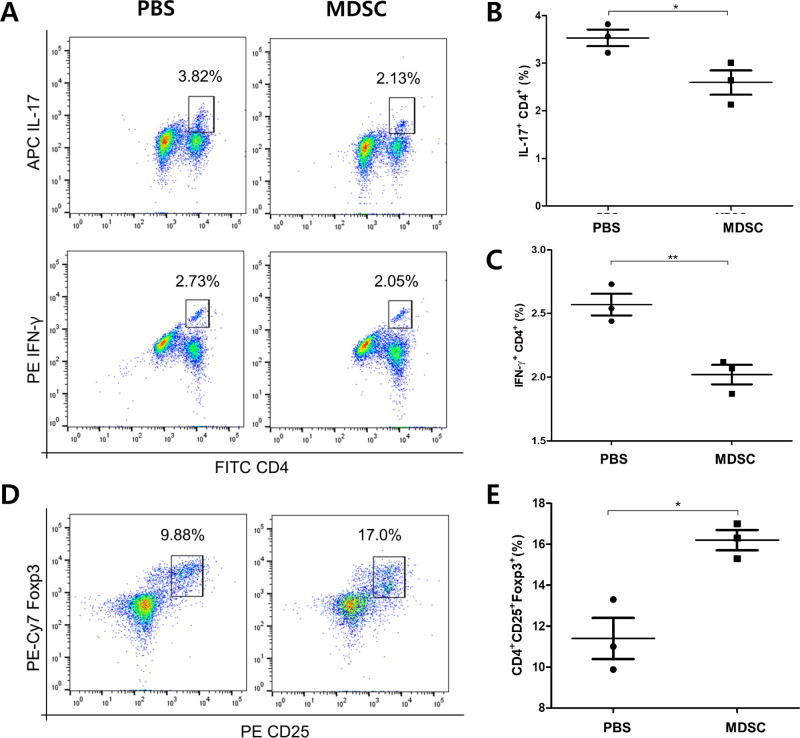
Figure 3.
Frequencies of pathogenic effector Th1 and Th17 cells and Treg cells in draining LNs in EAU. (A) Representative flow cytometry plots showing populations expressing IFN-γ or IL-17 cells after CD4+ gating. (B) Quantitative analysis of IL-17+ CD4+ cell populations (n = 3). (C) Quantitative analysis of IFN-γ CD4+ cell populations (n = 3). Comparison between MDSCs and PBS groups showed that both Th1 and Th17 cells presented decreased frequencies in MDSCs group. (D) Representative flow cytometry plots showing the population of CD25+ Foxp3+ cells after CD4+ gating. (E) Quantitative analysis graph of CD4+ CD25+ Foxp3+ cells (Treg) (n = 3). MDSC group had an increased ratio of Treg cells when compared with that in the PBS group. Representative flow cytometric data from three independent trials with pooled cells from more than three mice per group. *P < 0.05; **P < 0.01.

