Figure 3.
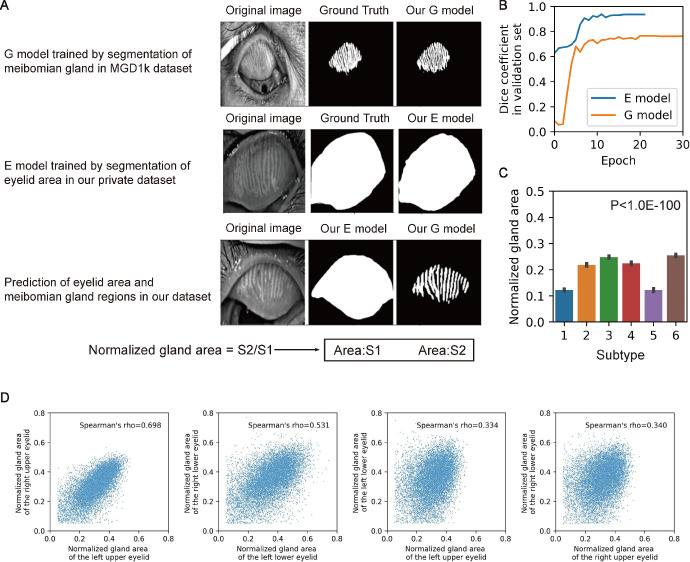
Area of meibomian gland regions differ among image subtypes. (A) Illustration of deep learning models segment eyelid area (E model) and meibomian gland regions (G model). The ratio of outputs of two models is defined as the normalized gland area of the meibomian gland region. (B) Dice coefficient of E model and G model in training processes with an early-stop patience. (C) Normalized gland area of 6 subtypes was compared using 1-way ANOVA analysis, and F-test was applied to calculate the P values. (D) Normalized gland area of different eyelids in patients with dry eye. Spearman's rank correlation coefficient was calculated and shown.

