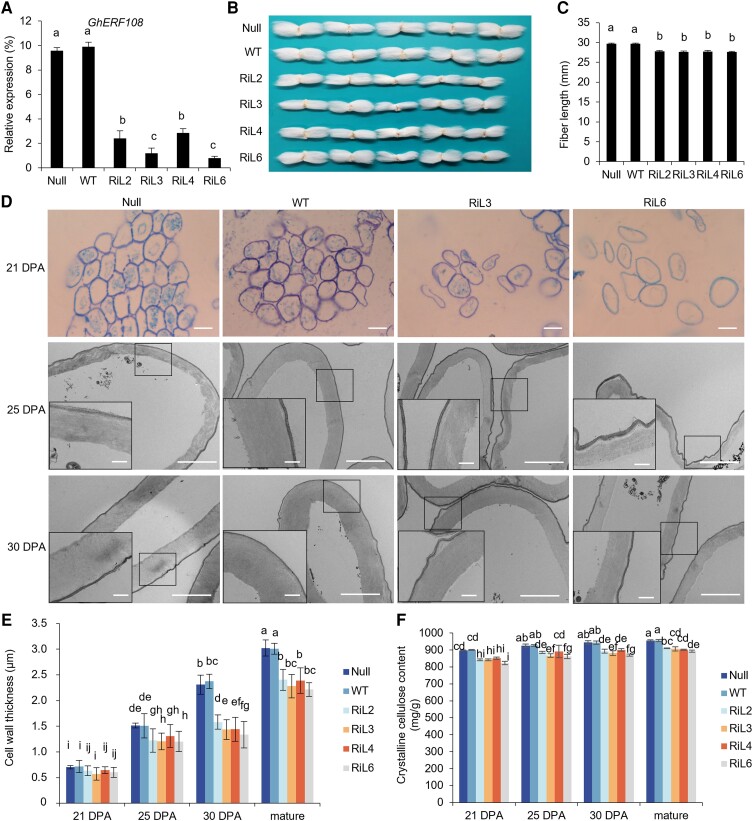
Figure 2.
Phenotypic analysis of GhERF108 RNAi transgenic cotton. A) RT-qPCR analysis of GhERF108 expression in 21 DPA fibers of the GhERF108 RNAi transgenic lines (T2 generation) and controls (Null and WT). GhUBI1 was used as an internal control for normalization. B) Comparison of mature fiber length of the GhERF108 RNAi transgenic lines and controls (Null and WT). C) Measurement and statistical analysis of mature fiber length of the independent GhERF108 RNAi transgenic lines and controls (Null and WT) (n ≥ 50, and at least 20 bolls from 15 plants for each independent line). D) Cross-sections of fibers. (Upper) Cross half-thin sections of 21 DPA fibers of the GhERF108 RNAi transgenic lines (RiL3 and RiL6) and controls (Null and WT) by light microscopy. Scale bars = 50 µm. (Bottom) Ultrathin sections of 25 and 30 DPA fibers of the GhERF108 RNAi transgenic lines (RiL3 and RiL6) and controls (Null and WT) by TEM. Scale bars = 2.0 µm. The rectangle marked at a comparable and magnified position in each fiber cell. Scale bars = 0.5 µm. E) Measurement and statistical analysis of fiber cell wall thickness of the GhERF108 RNAi transgenic lines and controls (Null and WT) (n ≥ 50, and at least 50 seeds from 15 plants for each line). F) Measurement and statistical analysis of crystalline cellulose content in fibers of the GhERF108 RNAi transgenic lines and controls (Null and WT). The bolls in the bough located between the third and fourth internodes of cotton plants were randomly collected for fiber phenotypic analysis, and the mean value and Sd were calculated from 3 biological replicates. Values marked with different letters indicate statistically significant differences (P < 0.05) between each group according to the Tukey HSD multiple range test. RiL, GhERF108 RNAi transgenic cotton lines.

