FIG. 1.
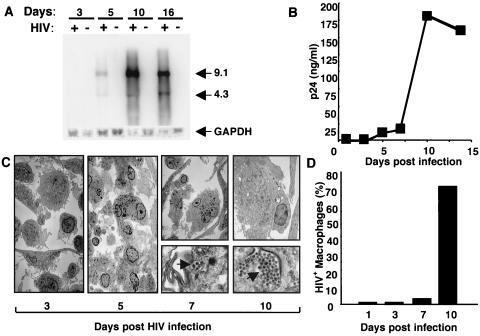
Kinetics of HIV-1 infection in monocyte-derived adherent macrophages. (A) Cells were exposed to HIV-1 for the indicated intervals, and mRNAs were extracted and examined by Northern blotting. Bands of 9.1 and 4.3 kb correspond to viral gag/pol and env mRNAs, respectively. (B) Supernatants were collected from infected cultures (days 1 to 15) for p24 ELISA. (C) Cells were incubated for 3 to 10 days after infection and processed for TEM. Original magnification, ×10,000. Ultrastructure analysis revealed detectable virions (C and D) in macrophages by 5 to 7 days postinfection, with increasing virus numbers per cell (C) and numbers of infected macrophages (D) being most evident at or after day 10, as quantified by counting ≥200 cells/time point. The data shown correspond to a representative experiment (n ≥ 4).

