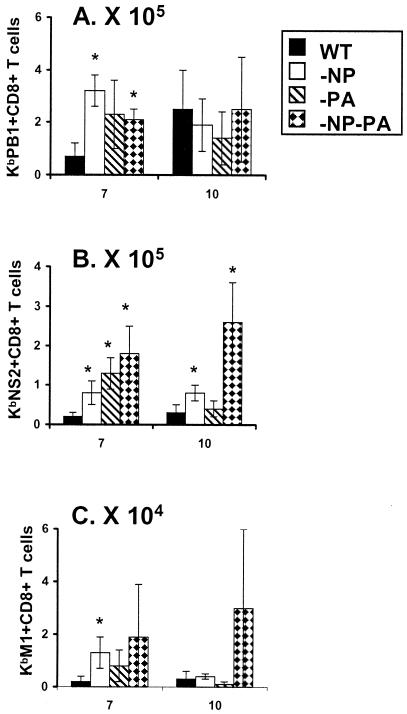
FIG. 2.
Localization of CD8+ KbPB1703+, CD8+ KbNS2114+, and CD8+ KbM1128+ IFN-γ+ T cells to the respiratory tract of virus secondarily challenged mice. This is the same experiment shown in Fig. 1. Individual BAL samples were stimulated with 1 μM concentrations of the PB1703-711 (A), NS2114-121 (B), and M1128-135 (C) peptides for 5 h and stained for IFN-γ expression (PepC assay). The numbers of IFN-γ+ CD8+ T cells were calculated and expressed as means ± standard deviations. Differences from the WT group are indicated by an asterisk (P ≤ 0.05, by Student's t test).

