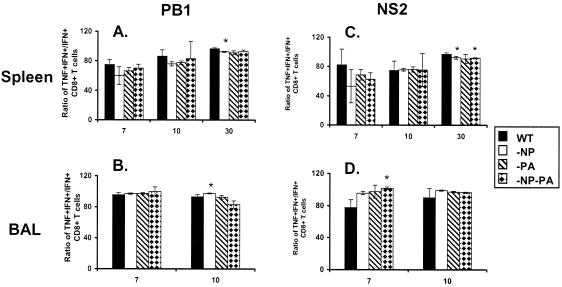
FIG. 5.
Prevalence of IFN-γ+ TNF-α+ CD8+ KbPB1703+ and CD8+ KbNS2114+ T cells in a secondary response. The mice were primed and challenged as described in the legend to Fig. 1. The levels of TNF-α+ and IFN-γ+ production were determined by intracellular cytokine staining subsequent to peptide stimulation (see legend to Fig. 2), and the IFN-γ+ TNF-α+/IFN-γ+ ratios were determined for the BAL fluid and spleen populations. The results are expressed as means ± standard deviations, and significant differences from the findings for the WT group are indicated by an asterisk (P ≤ 0.05).

