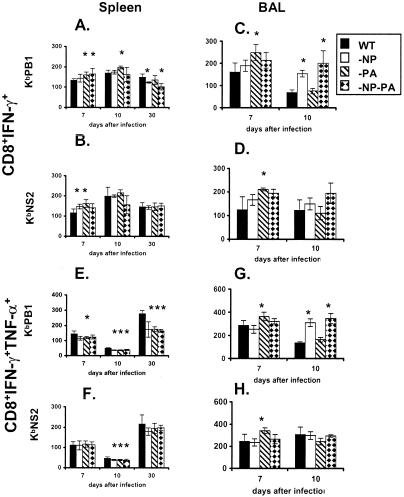
FIG. 6.
Intensity of IFN-γ and TNF-α staining for peptide-stimulated CD8+ KbPB1703+ and CD8+ KbNS2114+ T cells. The MFI values are shown for IFN-γ+ (A to D) and TNF-α+ (E to H) in T cells from spleen (A, B, E, and F) and BAL samples (C, D, G, and H). The statistical analysis compares values significantly different from those for the WT, and the asterisk denotes P ≤ 0.05.

