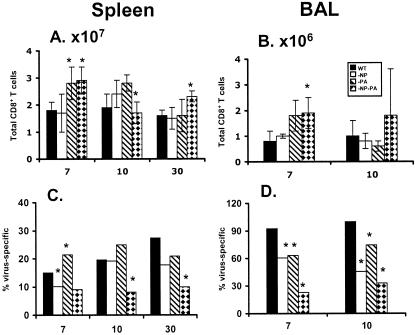
FIG. 7.
Comparison of the prevalence of epitope-specific and nonspecific CD8+ T cells. The total CD8+-cell counts (A and B) were subdivided to compare the size of the virus-specific (C and D) IFN-γ+ CD8+-T-cell sets from Table 1. (A and C) Spleen populations; (B and D) BAL sample populations. The asterisk indicates P ≤ 0.05, where the −NP, −PA, and −NP−PA groups were compared to WT by a two-sided exact P value for the two-sample Wilcoxon rank-sum test.

