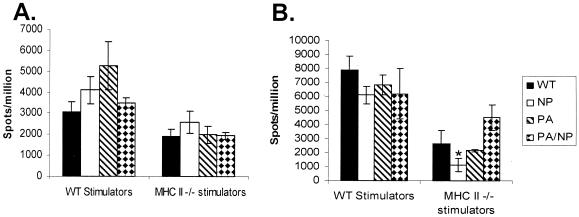
FIG. 8.
ELISPOT analysis of the influenza virus-specific CD8+-T-cell response. The total virus-specific response assay was performed following primary (A) or secondary (B) infection with the WT, −NP, −PA, and −NP−PA influenza viruses. Purified CD8+ splenocytes from infected mice were incubated for 48 h with MHC class II+/+ (B6) and MHC class II−/− (IAb−/−) APCs that were infected in vitro with WT HKx31 influenza virus. The numbers of IFN-γ-producing cells are expressed as spots per million CD8+ T cells. The results are shown as means ± standard errors (n = 4), and the asterisk indicates values that differed significantly from the WT result (P < 0.05). The analysis was repeated (data not shown) with comparable results.

