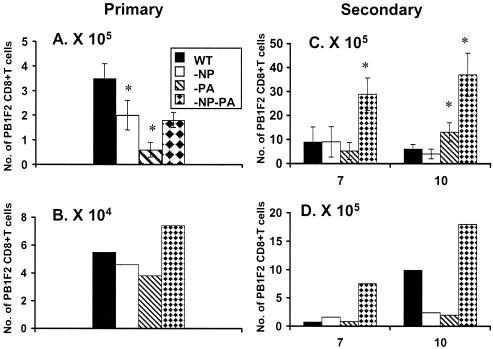
FIG. 9.
Prevalence of CD8+ PB1-F262 population in the primary and secondary response. The IFN-γ+ CD8+ PB1-F262+-T-cell numbers (per mouse) in spleen (A and C) and BAL sample (B and D) populations were determined by the PepC assay following primary (day 10, panels A and B) and secondary (days 7 and 10, panels C and D) i.n. challenge. (A and C) Results from spleen and BAL samples for primary infection; (C and D) data from spleen and BAL samples for secondary infection. The HKx31 WT and mutant viruses were given i.n. while the homologous PR viruses were given i.p. 6 weeks previously to those mice that were secondarily challenged. The values for spleen that were significantly different from those for the WT are identified by an asterisk (P < 0.05). Spleen samples were tested individually, and the BAL samples were pooled from the four mice. The experiment was repeated with comparable results (data not shown).

