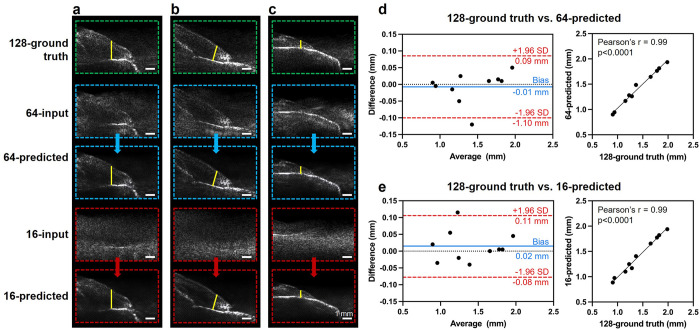
Fig 4. Gingival thickness measurement comparison between ground truth and predicted images.
Gingival thickness (marked as the yellow line) measured from 128-channel ground truth image, 64-channel predicted image, and 16-channel predicted image on three representative teeth with (a) large, (b) medium, and (c) small gingival thickness. Bland-Altman plot and Pearson correlation of gingival thickness measurement comparison of (d) 128-ground truth vs. 64-predicted and (e) 128-ground truth vs. 16-predicted.

