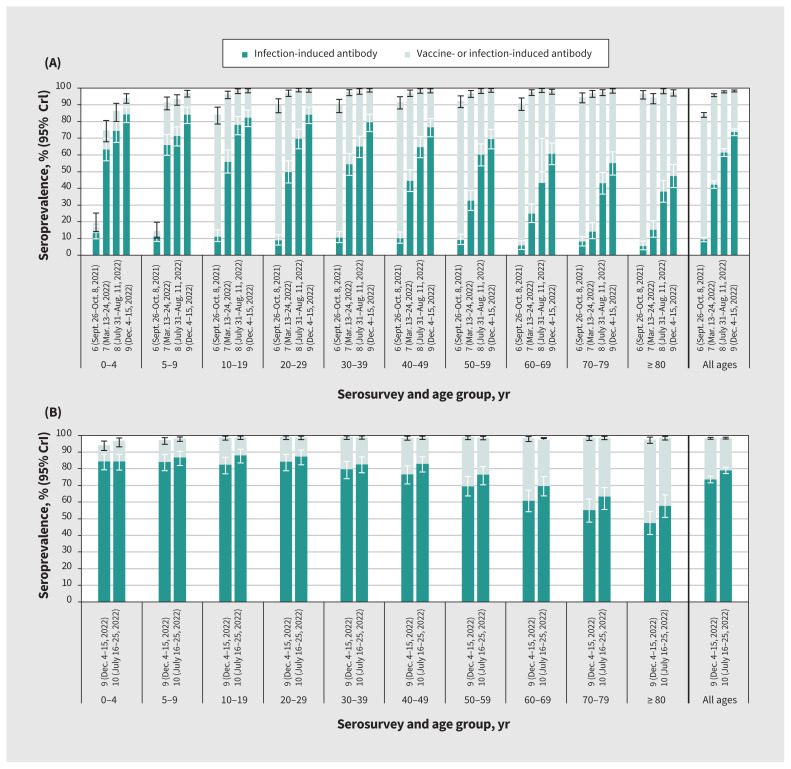
Figure 2:
Cumulative vaccine- and infection-induced SARS-CoV-2 seroprevalence by age group, sixth to tenth serosurveys, in the Lower Mainland, British Columbia, Canada (September 2021–July 2023). (A) Side-by-side comparison of the sixth to ninth serosurveys to illustrate seroprevalence progression. (B) Ninth and tenth serosurveys, presented separately for comparison of recent age-related patterns. Detailed findings are provided in Table 2. Darker bars indicate infection-induced seroprevalence. Lighter bars, combined with the darker bars, indicate overall (vaccine-induced, infection-induced or both) seroprevalence. Infection-induced estimates were defined by anti-nucleocapsid positivity. Overall estimates were defined by anti-spike or anti-nucleocapsid positivity. Estimates were based on Bayesian analyses, standardized for age, sex and health authority. Estimates from the sixth to eighth serosurveys are updated from our previous study,9 consistently applying the same nonorthogonal approach. Note: CrI = credible interval.

