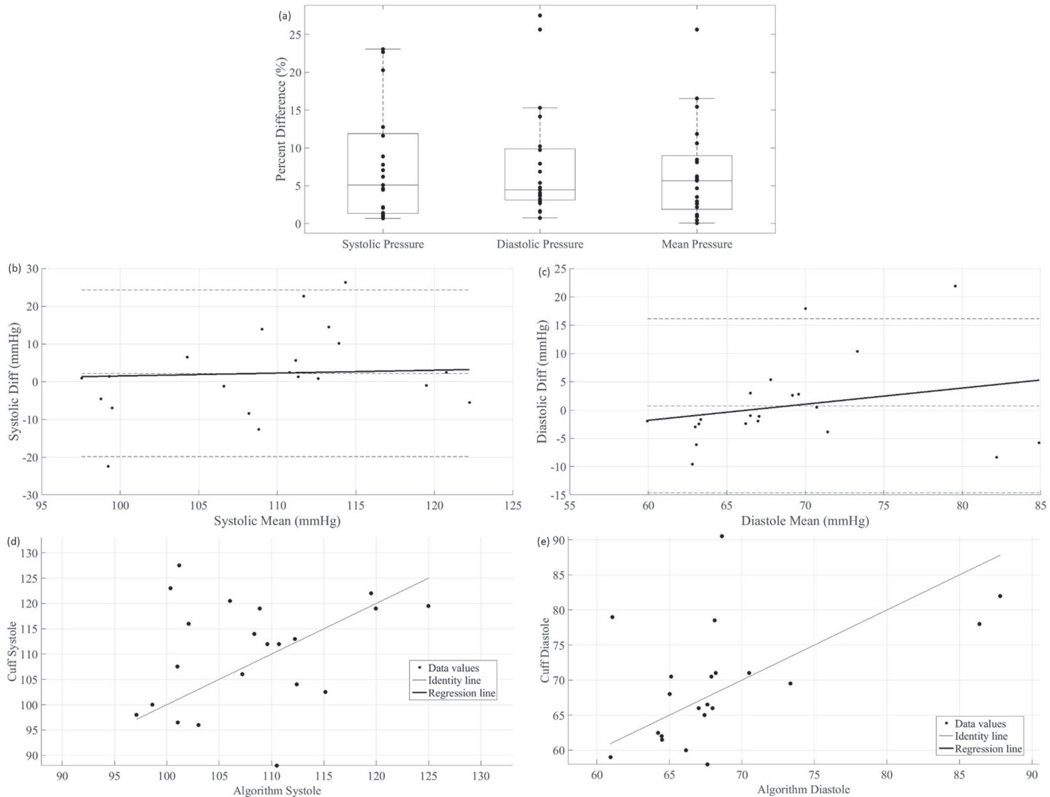
Fig. 4.
Statistical analyses from the 21 healthy volunteers. The k-fold determined model correction has been applied. In (a), a box plot of results is shown. Mean arterial pressure was calculated as 1/3 of the systolic pressure plus 2/3 of the diastolic pressure. In (b), the systolic Bland-Altman plot is displayed, i.e. the difference between the cuff and the algorithm’s systolic pressures is plotted against the mean of the cuff and the algorithm’s systolic pressures. In (c), the diastolic Bland-Altman plot is displayed. In (d), a correlation plot is displayed showing the systolic cuff result vs. the systolic algorithm result. The ordinary product regression is used to find the regression line displayed in the plot. In (d), a correlation plot is displayed for the diastolic pressure.

